What About the Election – A Few Simple Charts

As we enter the election season leading up to November 5th, I expect increased market volatility and an increase in client inquiries about the election and how it will affect stock and bond prices. I do have some opinions, but it is important to remember that historical data suggests political affiliation has minimal impact on long-term stock market performance. Instead, investors should focus on key drivers that have historically influenced market trends: Federal Reserve policy, economic growth, inflation, and the trend in place. Additionally, monitoring market sentiment can provide valuable insights, particularly for individual investors navigating short-term fluctuations.
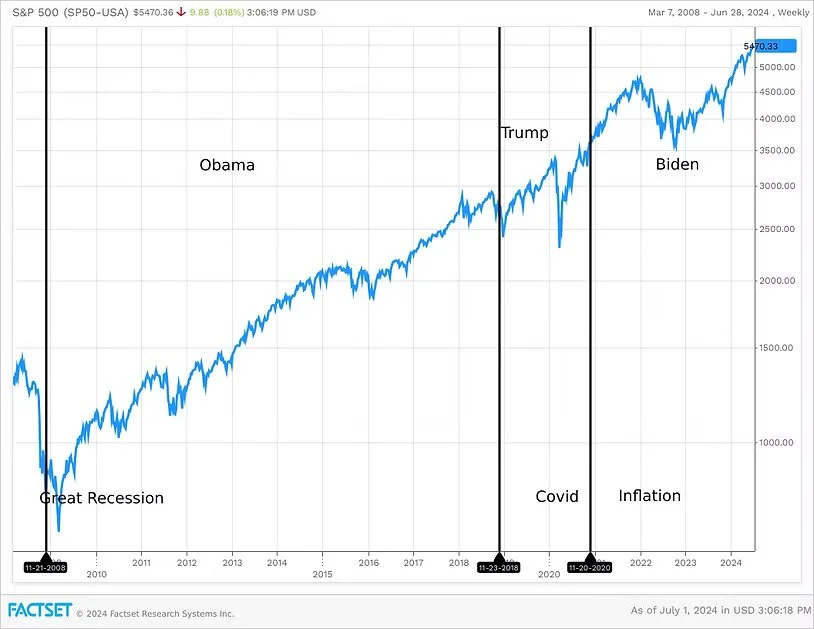
Chart 1
Chart 1 highlights three key observations regarding market performance across presidential terms: During the current and previous two administrations, markets have demonstrated a resilience to political party affiliation, instead focusing more on the underlying health of the economy. Secondly, every president encounters unforeseen challenges that can influence market performance like Covid or geopolitical events. Unfortunately, these factors or ‘black swan events’ are unpredictable by their very nature. And thirdly, despite ever present short-term fluctuations, the dominant market trend still appears to be up reflecting our view that the secular bull market in stocks that began in the ashes of the Great Recession remains alive and well.
Chart 2 illustrates the Federal Reserve's recent interest rate hikes (blue line) alongside the Personal Consumption Expenditures (PCE) price index, the Fed's preferred inflation gauge. As evident, the PCE has declined and shows signs of further decrease. This trend suggests the Fed may have room to ease interest rates later in 2024. I think that will have a substantially greater impact on the markets than the election.
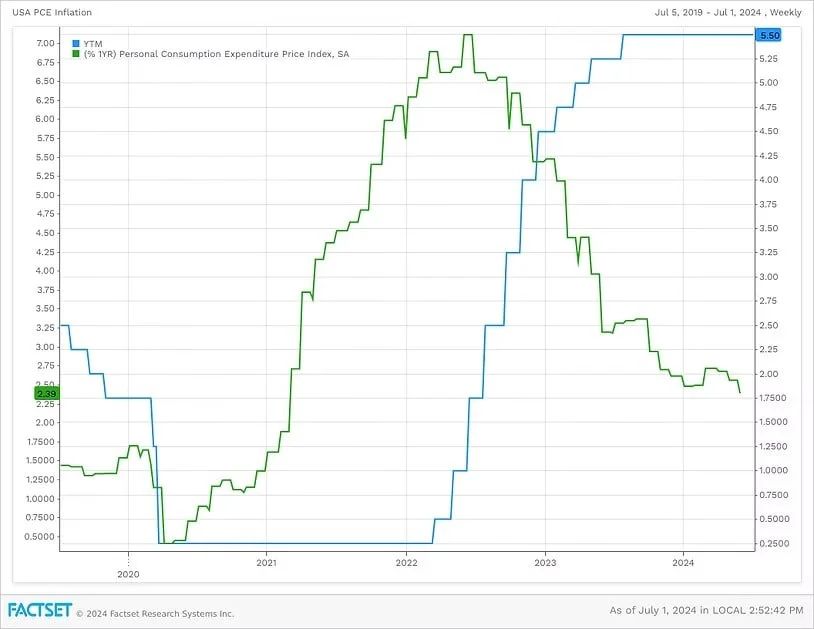
Chart 2
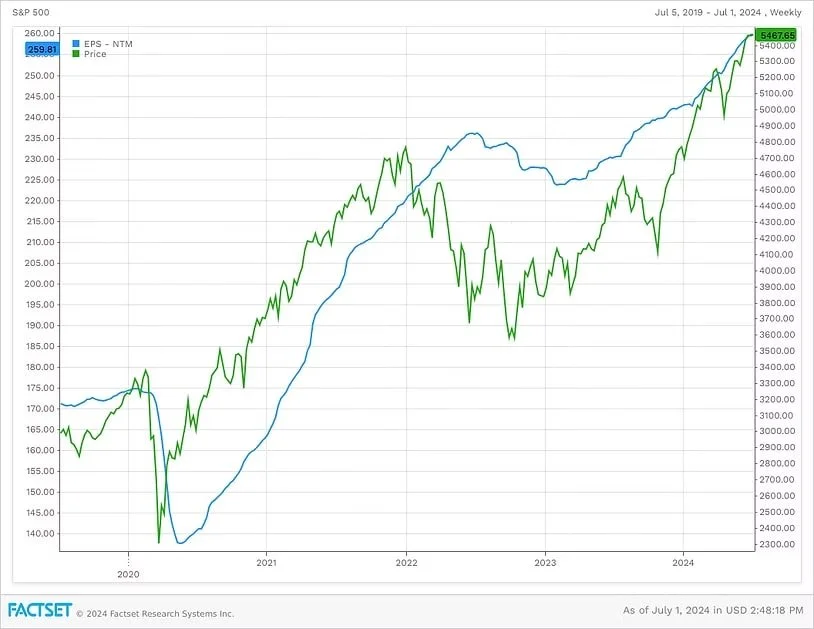
Chart 3
Chart 3 examines the relationship between corporate earnings and S&P 500 performance. While the COVID-19 pandemic caused a temporary decline in earnings, the stock market largely anticipated this drop as the pandemic spread, selling off beforehand (blue line). This highlights the forward-looking nature of stock prices, which generally anticipate future economic performance rather than react to them. The general rule of thumb is that markets usually look about six-months ahead unless something unexpected occurs. The current upward trend in both forward 12-month earnings estimates and stock prices suggests a positive outlook for the market, giving credence to the Emerald Asset Management view that it’s still a bull market.
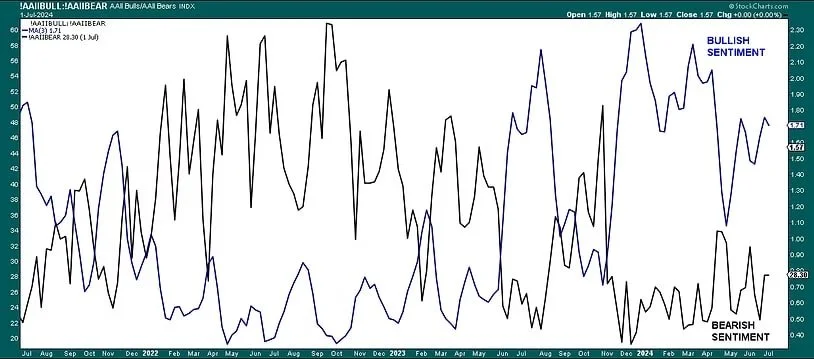
Chart 4
The chart above shows one measure of the current levels of bullish and bearish sentiment in the stock market. (This is just one example of sentiment. It is our opinion that market sentiment is best measured using many different measures to get a better overall reading.) The AAII Bullish Bearish sentiment indicator is a contrarian indicator that gauges investor confidence in the stock market's direction over the next six months. By analyzing the survey's results, we can see if investors are leaning heavily bullish or bearish, which can potentially signal an opposite market move. Right now, it appears that there are more bulls than bears out there but readings are not currently at extreme levels. As stated earlier, we anticipate volatility in the coming months but we view weakness as buying opportunities.