Running with the Bulls
As the secular bull market that began in March of 2009 is starting to get a little age on it, naturally our phones are starting to ring a little bit (not a lot) with questions about how much life we think this bull market has left in it. It seems as though it's human nature for investors to be conditioned to expect a repeat of what just happened. We mortals tend to find ourselves fighting the last war as opposed to focusing on the future. In the late 1990's during the tech boom, most people thought the party would never end. In 2009 it seemed as though the world was headed for the next Great Depression. Fear and greed tend to drive investor behavior more so than rational analysis.
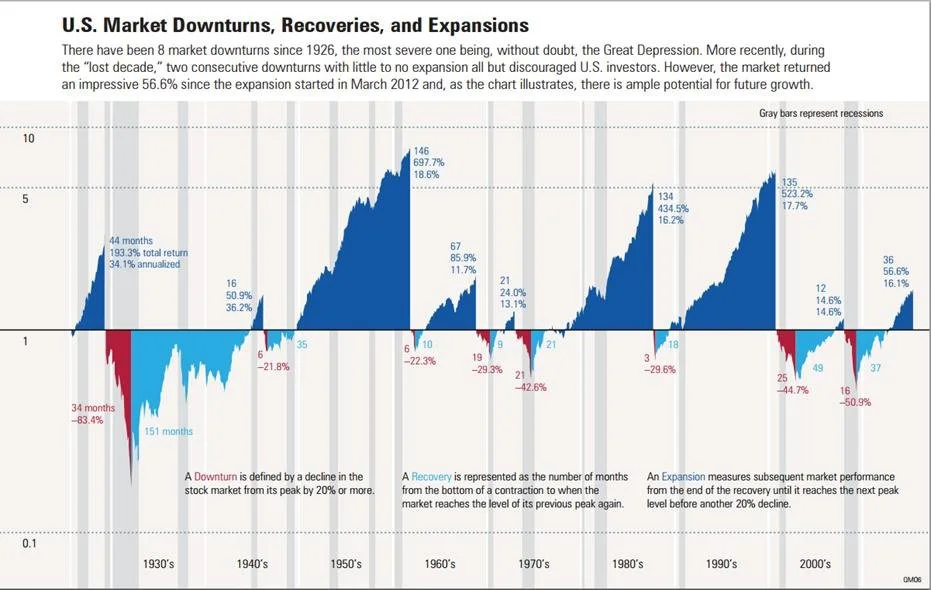
Morningstar recently released a study that measured the time and magnitude of stock market downturns, recoveries and expansions. IF one is willing to accept the premise that time and magnitude are acceptable methods for forecasting bull and bear markets then this bull market could have plenty of room to run according to the chart below. The general idea behind investing is to stay with the dominant trend until it ends.
© Morningstar, Inc. 2015. All rights reserved. Use of this content requires expert knowledge. It is to be used by specialist institutions only. The information contained herein: (1) is proprietary to Licensor and/or its content providers; (2) may not be copied, adapted or distributed; and (3) is not warranted to be accurate, complete or timely. Neither Licensor nor its content providers are responsible for any damages or losses arising from any use of this information, except where such damages or losses cannot be limited or excluded by law in your jurisdiction. Past financial performance is no guarantee of future results.
However, even though I think we are in a secular bull market that does not mean that volatility and short term corrections can't or won't happen - they absolutely will. I decided to do a quick study of my own. Using the popular Shiller data set which can be found here, I decided to see just how volatile the U.S. stock market has historically been. Going back to January of 1871, the average monthly rate of change in the price level of U.S. equities has been apositive 0.44% per month with a standard deviation of 4.08%. For the non-statisticians, the easiest way to think about these numbers is this: while the stock market change averaged a positive 0.44% per month (not counting dividends), about two thirds of the time the he monthly change in the level of the stock market was constrained to a range of minus 3.64% to positive 4.52% . About 95% of the time range was froma a minus 7.72% to a positive 8.60%. I ran the same calculations since January of 1950 to take out the effects of the Great Depression and to reflect our more modern economy and the average monthly returns increased while volatility decreased. The same was true over rolling three month time periods. The table below shows the results of the one month and three month data since 1871 and since 1950.
The main points to remember from these two studies in my opinion are 1) that we are in a secular (long term) bull market with the potential for many more years before the next secular bear market sets in, and 2) that volatility always has been and always will be a fact of life for stock investors.


