Corrections are part of Normal Markets
“The game of speculation is the most uniformly fascinating game in the world. But it is not a game for the stupid, the mentally lazy, the person of inferior emotional balance, or the get - rich - quick adventurer. They will die poor.”
- Jesse Livermore
The first quarter of 2018 started out much like most of 2017. That is until January turned into February. With the turn of the calendar, it seemed as though stocks fell off the side of a mountain. But did they? The total return for the S&P 500 was only a negative 0.76%. Furthermore the total return for the S&P 500 was a positive 13.99% for the trailing twelve months. That really doesn’t sound much like the picture being painted by CNBC and other news organizations who profit by selling fear and greed to boost ratings. The detail being overlooked is that the lack of volatility in 2017 wasn’t a normal year for stocks. The gyrations so far in 2018 are more “normal”. While the correction might not be over as of this writing, we don’t think it will morph into a full blown bear market for one primary reason - most bear markets tend to be associated with recessions. By our count there were only two significant bear markets since the early 1960’s that weren’t associated with recessions. The first one occurred in 1966 and the more recent and notable one was the infamous crash of ‘87. We live in the world of probabilities in this business and we believe that investors are generally best served by playing the odds.
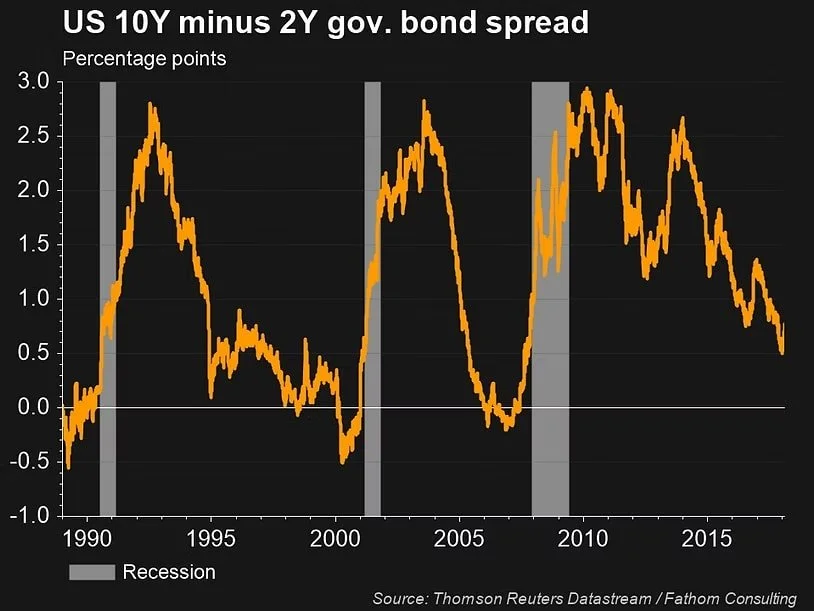
NONE of our favorite recession indicators are flashing signs of an impending recession. For starters, jobless claims are trending lower. Next, the yield curve is nowhere near inverting. U.S. GDP and the Index of Leading Economic Indicators are both trending higher. Could a black swan fly by and cause some unforeseen shock to the economic system? Sure it could but those events are by definition unpredictable. With the information that we have today the economy still looks healthy. And bull markets haven’t historically died of old age.
That said, there is some activity beneath the surface of the capital markets that we find noteworthy. First of all, there appears to be some rotation from the technology sector into some of the commodity related stocks. This phenomenon appears to be occurring against a backdrop of rising interest rates. We point this out for two reasons. 2017 was the year of one decision - buy technology and hold on. Also, 2017 was particularly good to index funds. Since the S&P 500 is 25% technology, a lull or continued weakness in the sector could be detrimental to portfolios that don’t adjust accordingly. Also, if 25% of the stock market doesn’t participate but other sectors do well then indexers might have a rough year ahead. Please note: we do like technology as a longer term play and would not eliminate all technology stocks from portfolios. Rather we think that other sectors might offer more attractive opportunities as the tech sector corrects.
The rotation into commodities and commodity related investments suggests that inflation could be making a comeback. Fixed Income investors who not understand how to properly manage interest rate risk could see what they consider to be the “safe” portion of their portfolio under perform. So for now, we expect 2018 to be characterized by normal market behavior (higher volatility) as opposed to the abnormal behavior (lower Volatility) exhibited last year.
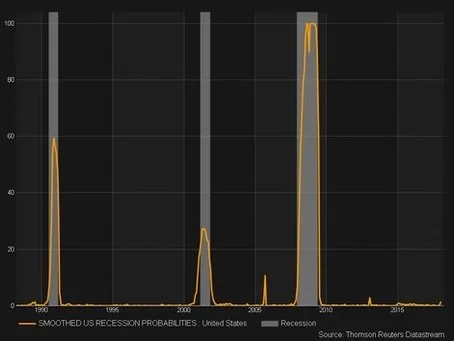
The chart above is the New York Fed Recession Probability Index (smoothed) going back to 1988 or 30 years. The line indicates the probability that the US economy is in recession and the shaded bars represent actual recessions. Conventional wisdom says that a reading of 20% or higher is cause for concern. Currently, the index reads 1.54%.