2019 - More Turbulence Ahead?
The stock market flew through the 2018 clouds with plenty of turbulence. We wouldn’t necessarily term 2018 as a bad flight but we’ve certainly had more pleasant experiences in the friendly skies. However as we continue our journey into the first quarter of 2019, the weather report is calling for more gusting winds which could carry stocks into their first formal cyclical bear market since 2011. However, we urge investors to keep in mind that while the trip could be bumpy, we don’t expect anything to knock the plane out of the sky. 2008 is a distant memory and we don’t expect a repeat of the disaster movie “Airport 2008”. We think the anticipated turbulence will subside by March or April.
So, while US equities could extend recent losses past the 20% threshold, we believe that our thesis that US stocks are in a Long-term Secular Bull Market remains intact. Therefore, our advice to investors is as always, to make sure that portfolios are properly allocated based on one’s individual risk tolerance and circumstances. Secondly, trading accounts should be positioned defensively and long-term investors should use periods of market weakness to accumulate shares of high quality stocks on sale.
In the charts that follow we attempt to explain why we are long-term bullish and short-term cautious and what it would take for us to have conviction that stocks will be likely to enter the dreaded bear market territory. But for now, put your seat back, read the paper and enjoy your flight. We think that flight number 2019 will end with a safe landing.
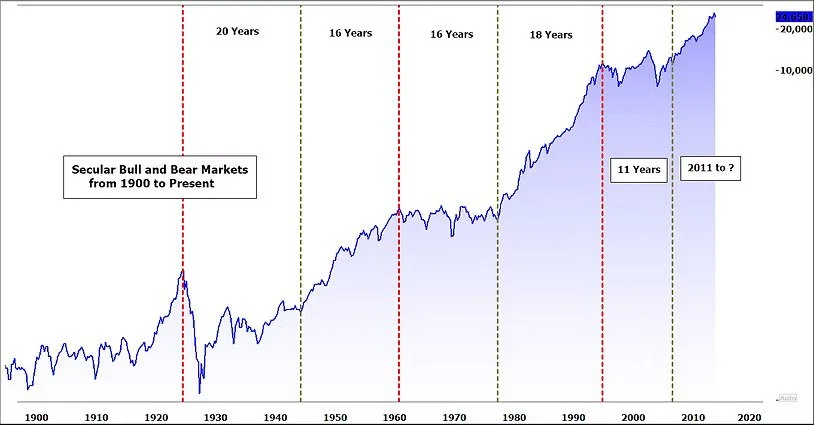
Defining the Trend - The chart below shows the Dow Jones Industrial Average since 1900. The Secular (long-term) Bull Market in US Equities that kicked off the 20th Century culminated in the Roaring ‘20’s and was followed by the Great Depression. The Secular Bear associated with the Great Depression lasted about 20 Years. The Secular Bull Market that began in 1950 lasted about 16 years based on the way we measure the start and end of a bull or bear market. And the pattern continues to repeat with the previous two Secular Bull Markets (1950 - 1966 and 1982 - 2000) lasting about 16 and 18 years respectively. We don’t agree with using the calendar to predict the beginning and end of Secular Bulls and Bears. But, we think this Secular Bull Market started in 2011. The mere passage of time argument would imply that this bull market has many years left to run.
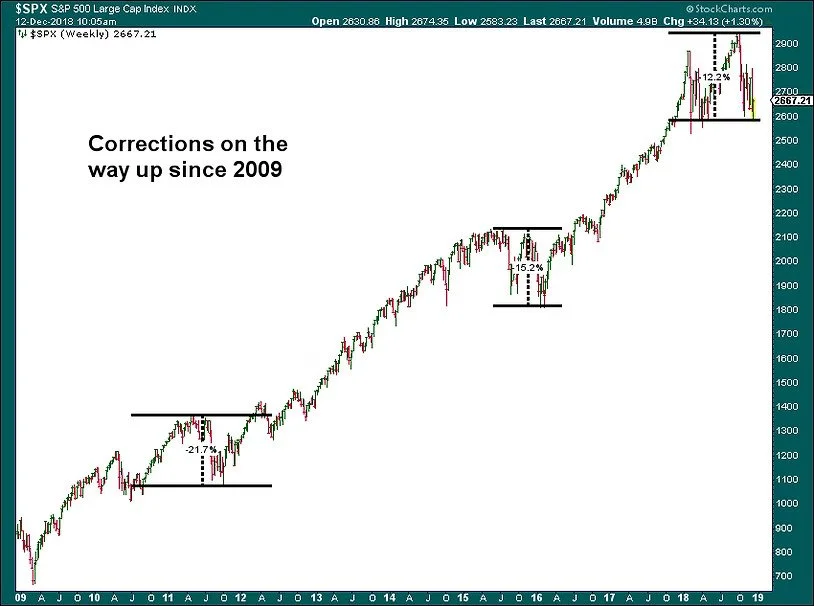
Cyclical Bulls and Bears - Within the context of Secular Bull and Bear Markets there always have been and there always will be shorter term corrections and Cyclical (shorter-term) Bull and Bear Markets. While Cyclical Bear Markets within the context of Secular Bear Markets can prove financially devastating, Cyclical Bears within Secular Bull Markets (like we think we are currently enjoying) are usually more shallow in magnitude and shorter in duration than when they occur in long-term bear markets. In the chart above, notice how the infamous Crash of ’87 didn’t derail the long-term bull. Compare that to the drawdowns in the Tech Wreck from 2000 - 2003 and the Financial Crisis of 2007 - 2009. The current correction started in early October and has only been about 12%.
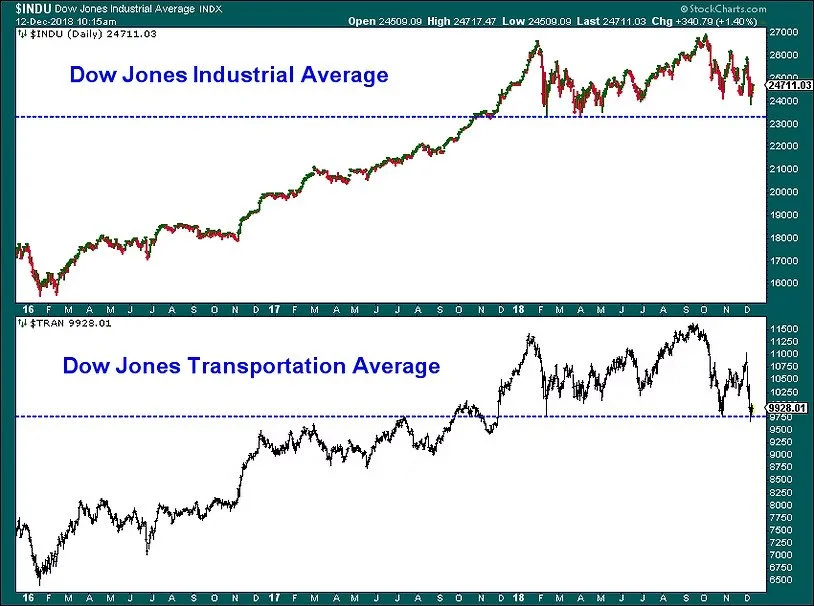
Our line in the Sand - If the Dow Jones Industrial Average closes below its 12 month low (23,533.20) and that is confirmed with a close below the 12 month low for the Dow Jones Transportation Average, we argue that the stock market will have presented a Dow Theory sell signal. While no strategy including Dow Theory is infallible, we would consider that to be strong evidence that the current correction could turn into a Cyclical Bear Market. As of this writing the Transportation Average has satisfied the necessary criteria but the Industrials have not. So we still consider the Primary Trend of the US Equity Market to be constructive.
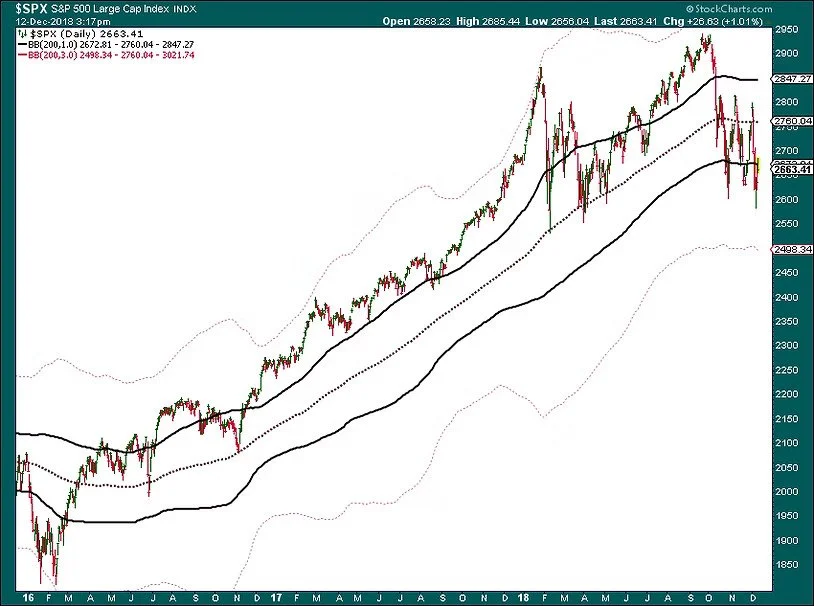
The S&P 500 is getting Oversold - The S&P 500 is trading over one standard deviation below its 200 day moving average. We think a bear case scenario would be three standard deviations below the 200 day moving average which is around 2500.
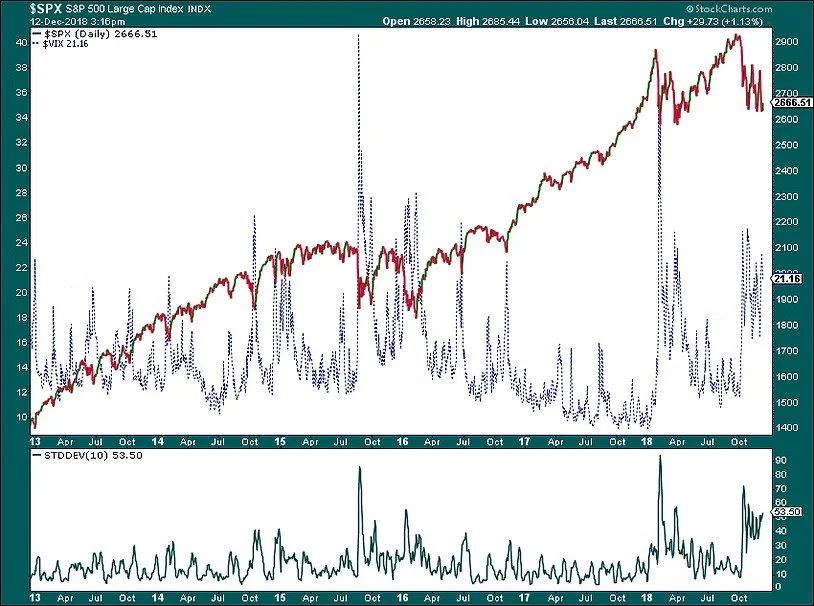
Volatility has picked up - volatility as measured by the VIX Index has marked increased nervousness in the stock market but we would like to see a print over 30 to call a bottom. The VIX is the blue line below and the reading is on the left axis.
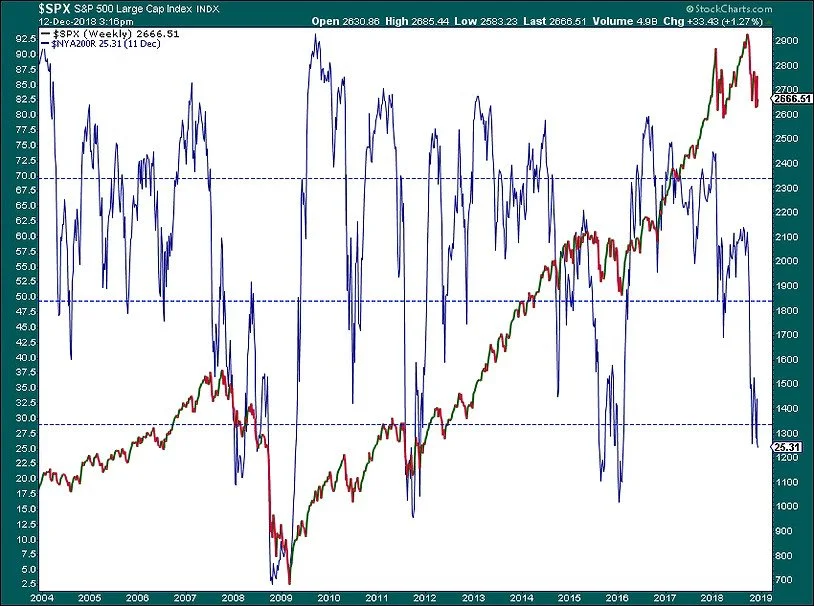
The percent of stocks above their 200 day moving average - One common proxy for the long term trend of a security is its proximity to its 200 day moving average. The fewer stocks that are above their 200 day moving average the closer stocks probably are to being washed out. While the number of stocks above their respective 200 day moving average has dipped to about 25%, we would like to see that number drop to the mid to upper teens and reverse to confirm that at least a tradable bottom has been made. While that hasn’t happened yet, the market appears to be getting close.
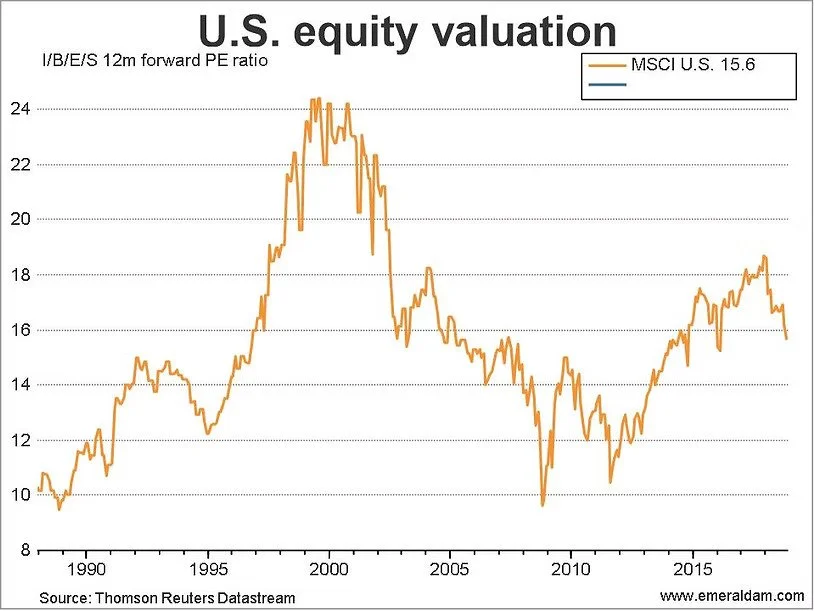
The Forward P/E Ratio has dropped back in line with its long term historical average….
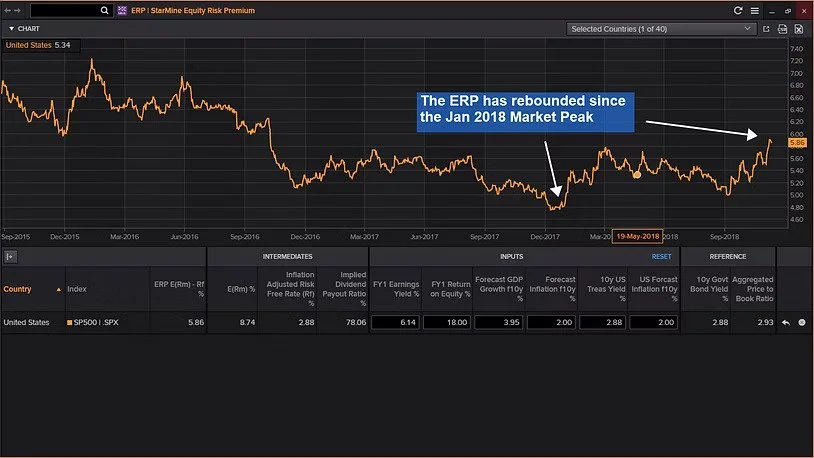
...and the Equity Risk Premium has come back up suggesting that valuations are no Longer a problem.
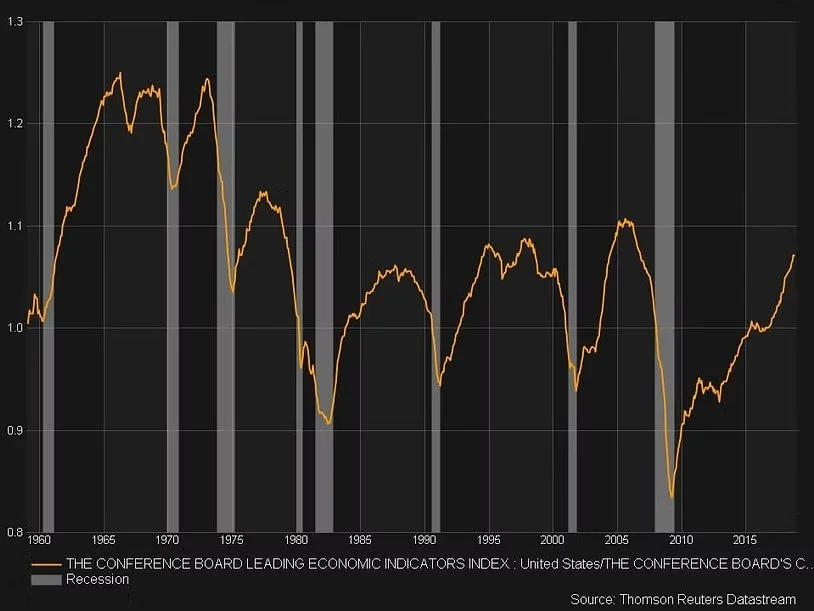
Our Favorite Indicator, the Leading Economic Indicators divided by the Coincident Indicators shows absolutely no trace of a recession on the horizon.

