Hold Your Positions, it’s a Bull Market (duh)
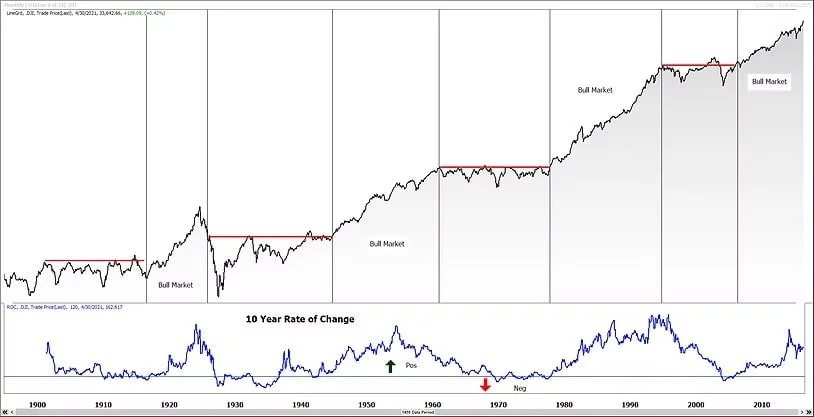
Dow Jones Industrial Average 1900 - Present
As long term investors, which most of our clients are, the goal is to buy high quality equity investments and hold onto those investments until something changes with the company or until it is apparent that an existing bull market has come to in end. Its not possible, in my opinion, to know when stocks have switched from bull to bear until after the fact. The good news is that it isn’t necessary to do so in order to be a successful investor. As can be seen in the chart above, secular bull markets (like the one we currently enjoy) usually last a really long time. For example, the last secular bull market in US equities lasted from 1982 until 2000 or about eighteen years. Not even the infamous Crash of ‘87 derailed that bull run. Having said that, we don’t subscribe to the notion of buy it and forget it. The savvy investor makes occasional adjustments to his or her portfolio over time weeding out the losers and reallocating into leading sectors. But the goal is to remain fully invested throughout the cycle.
On the other hand, traders should be more concerned with avoiding drawdowns as seen in the first quarter of 2020, while attempting to participate in the intermediate uptrends as they present themselves. The problem is that most investors aren't willing to do the hard work required in order to find success in the trading world so they should probably stick to long term investing.
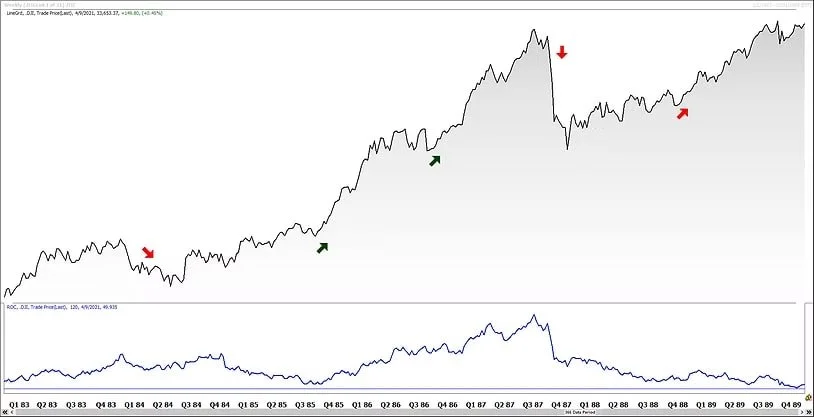
Dow Jones Industrial Average 1983 - 1989
The chart above shows a couple of down cycles in an otherwise long term bull market. The goal of the investor is to hold on through these drawdowns, confident in the quality of a well diversified portfolio and the dividend income that it generates. The goal of the trader is to avoid some of the volatility on the way down at the cost of inevitably missing some of the upside. The idea is to generate a portfolio with better risk-adjusted returns than that of the investor.
The chart below compares the Philadelphia Semiconductor Index (SOX) to the S&P 500 Index (SPX). An upward sloping line indicates that the semis are outperforming the S&P 500 which typically bodes well for the intermediate term. Therefore, market dips should be used for buying high quality names, in our opinion.
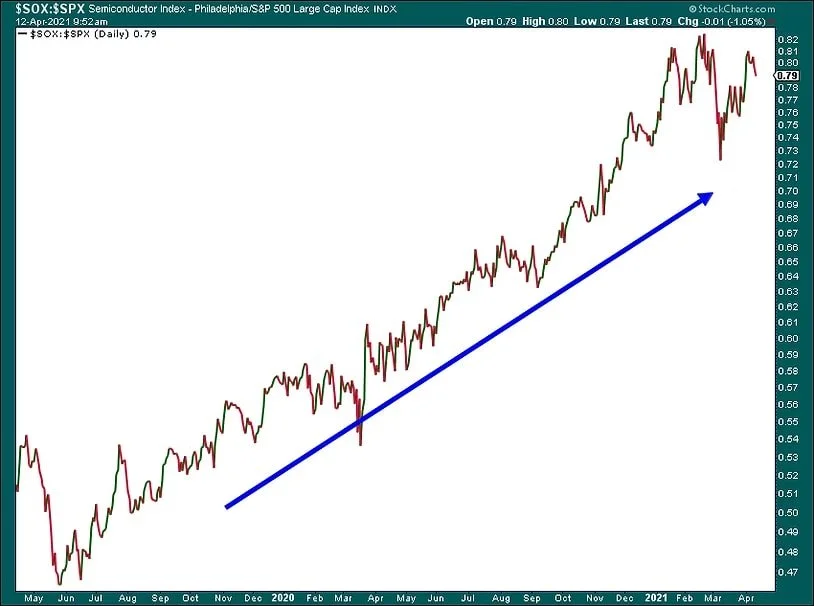
SOX divided by the S&P 500