A Bull Market With a Clock

A Bull Market With a Clock
Written by James Tharin, CFA
We have said for some time that stocks are in a secular bull market, a long advance that can survive several shorter rallies and selloffs. We count the beginning of the current secular bull market from October 2011 although the absolute low for the previous bear occurred on March 9, 2009. Within this secular bull market, we believe a new cyclical bull market began after the decline in April 2025 that resulted from President Trump’s tariff announcements. Technology and the AI buildout remain at the center of the current advance, and we continue to participate with an overweight to technology stocks, particularly semiconductors. At the same time, inflation and higher long-term interest rates are making the market less forgiving, and we would like to see more individual stocks join the rally. When the index rises because only a few large companies are doing most of the work, we call that weak market breadth. The distinction matters because we are growing more cautious about this shorter cycle without concluding that the long-term bull market has ended.
We look at two time horizons and ask two questions. Is the secular bull market in stocks still intact? And how healthy is the cyclical advance that we believe began in April 2025? That is the framework behind our outlook. It helps us respond to evidence as it changes without asking one day’s market action to answer a question about an entire decade.
What A Century of Stock Prices Shows
The outlined boxes on the chart mark two secular bear markets: roughly 1966 to 1982, when prices spent years failing to make lasting progress, and 2000 to October 2011, which included both the dot-com collapse and the financial crisis. The arrows beneath it mark the long bull periods from 1982 to 2000 and from October 2011 to today. The S&P 500’s breakout above its old highs in 2013 provided further confirmation of the current advance. Those boundaries are our interpretation of broad market eras, rather than precise dates on which an investor could have known to act.
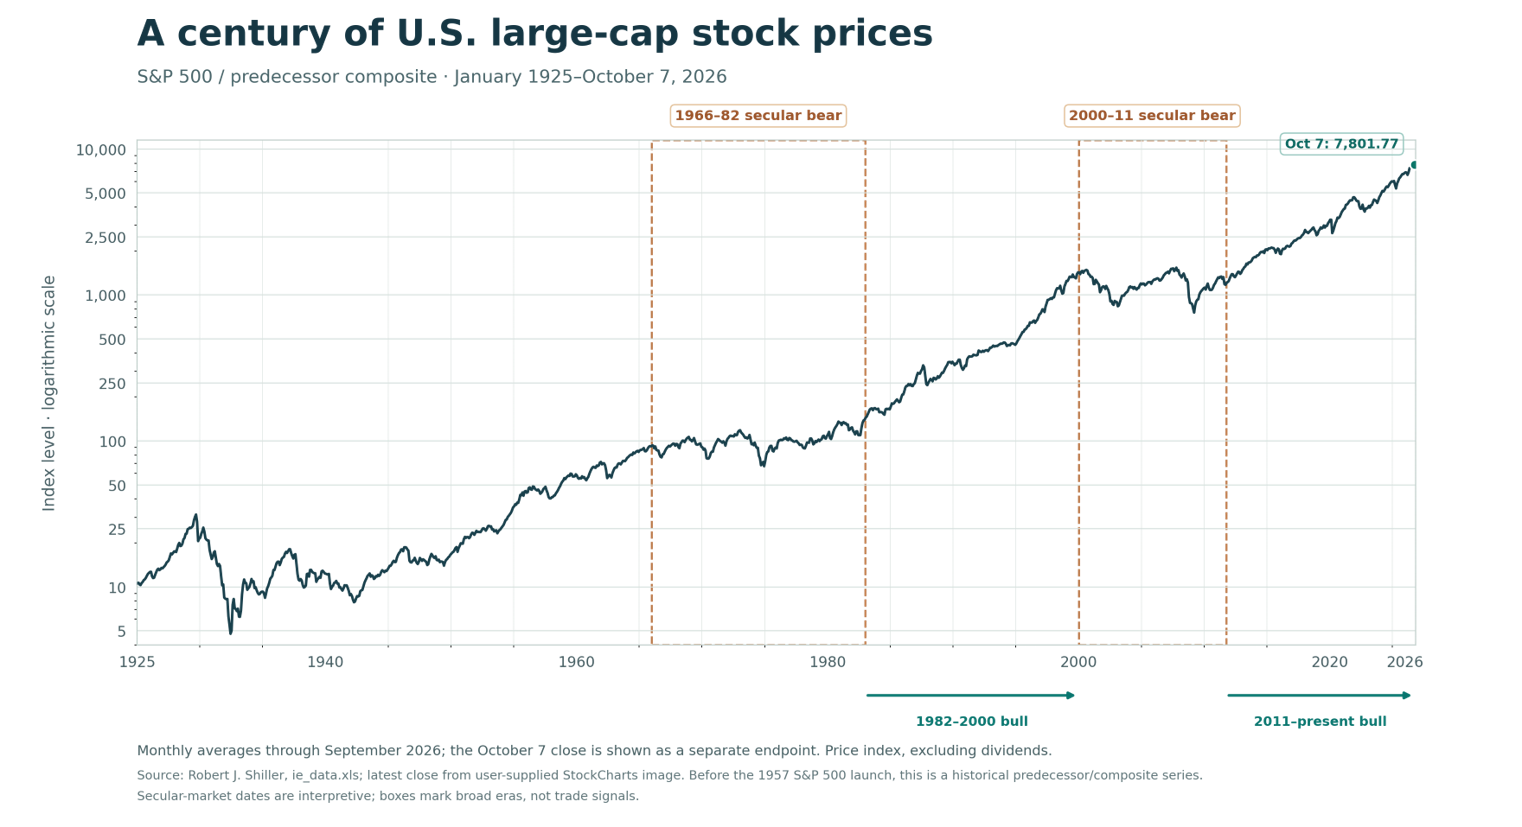
Original chart based on Robert J. Shiller’s monthly average price series, January 1925–September 2026. The October 7 close of 7,801.77 is a separately marked point from the supplied StockCharts image. The pre-1957 segment is a predecessor/composite series; prices exclude dividends and are not adjusted for inflation. Secular labels are interpretive.
There is a counterweight to that stock chart. For about four decades after the early 1980s, bond yields generally fell. That trend was a tailwind for both bond prices and stock valuations. The low in 2020 and the subsequent rise in yields suggest to us that the old secular bull market in bonds is over. Rates will move in both directions along the way, but we should no longer build our stock outlook on an assumption that long-term borrowing costs will keep falling.
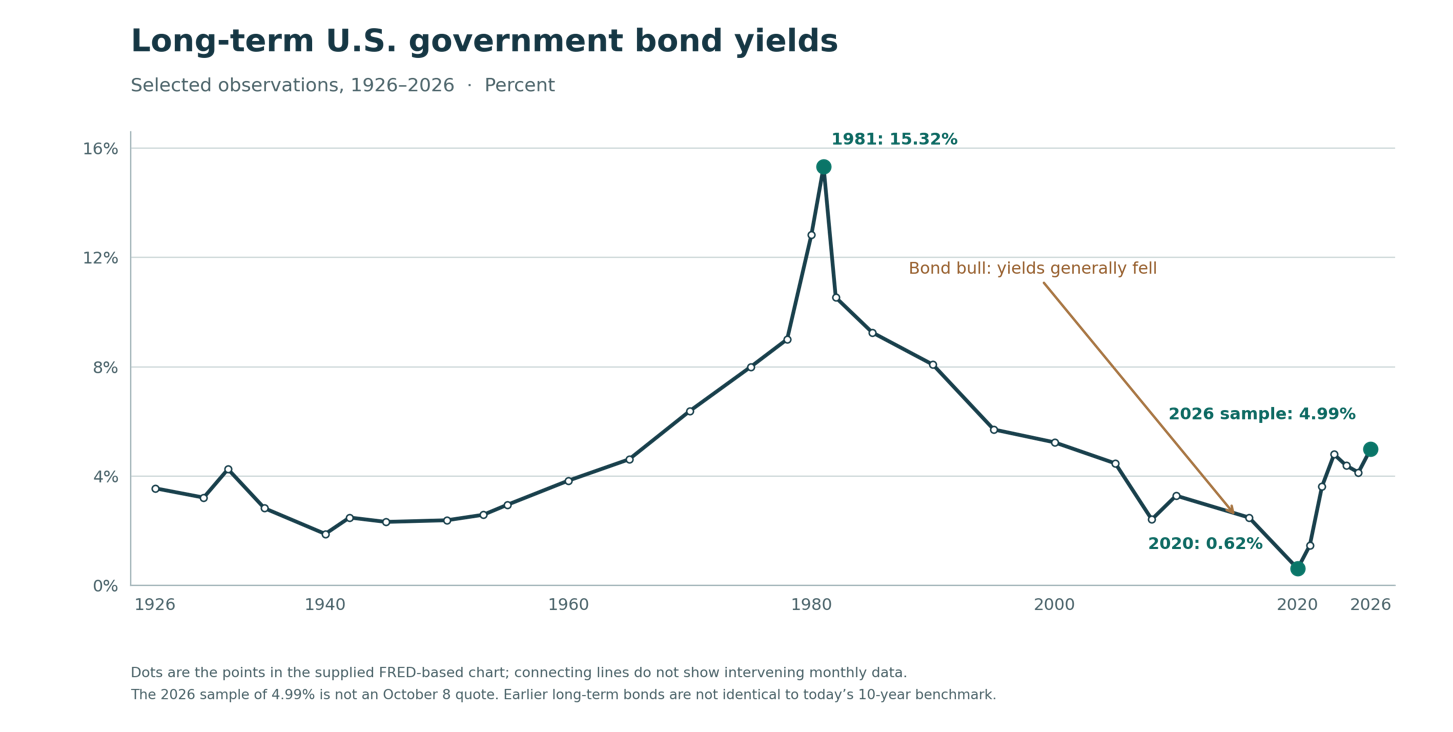
Recreated from the rate chart you shared, using its selected FRED-based observations; dots are observations and lines connect only those sampled dates. The 2026 sample is 4.99%, with no exact month specified in that chart. Early long-term bond yields are not identical to the modern 10-year Treasury benchmark.
As of late morning on October 8, the current 10-year Treasury yield was about 5.31% and the 30-year about 5.67%, according to Reuters. Those are more recent quotes than the last sampled point on the historical graphic. Rising oil prices were again adding to inflation concerns. If inflation keeps long-term yields high, bonds compete more directly with stocks and the cost of financing the AI buildout rises. In our view, inflation and persistently higher rates are the greatest threat to this secular stock bull.
Why We Are More Selective Now
Sector rotation can offer clues about how far a cyclical bull market has advanced. Energy often attracts attention when inflation pressures build. The energy sector has been unusually strong recently, even while technology companies continue to benefit from AI. That combination makes us watchful, but by itself it does not announce a top.
According to FactSet, energy was up 20.8% over the preceding rolling three months as of October 6, compared with 12.8% for technology and 3.8% for the S&P 500. Healthcare gained 3.1%, slightly behind the index, while consumer staples lost 2.1%. So the evidence of a shift into defensive stocks is mixed rather than broad. These are rolling three-month price changes through the October 6 intraday reading, not returns measured at the end of a calendar quarter.
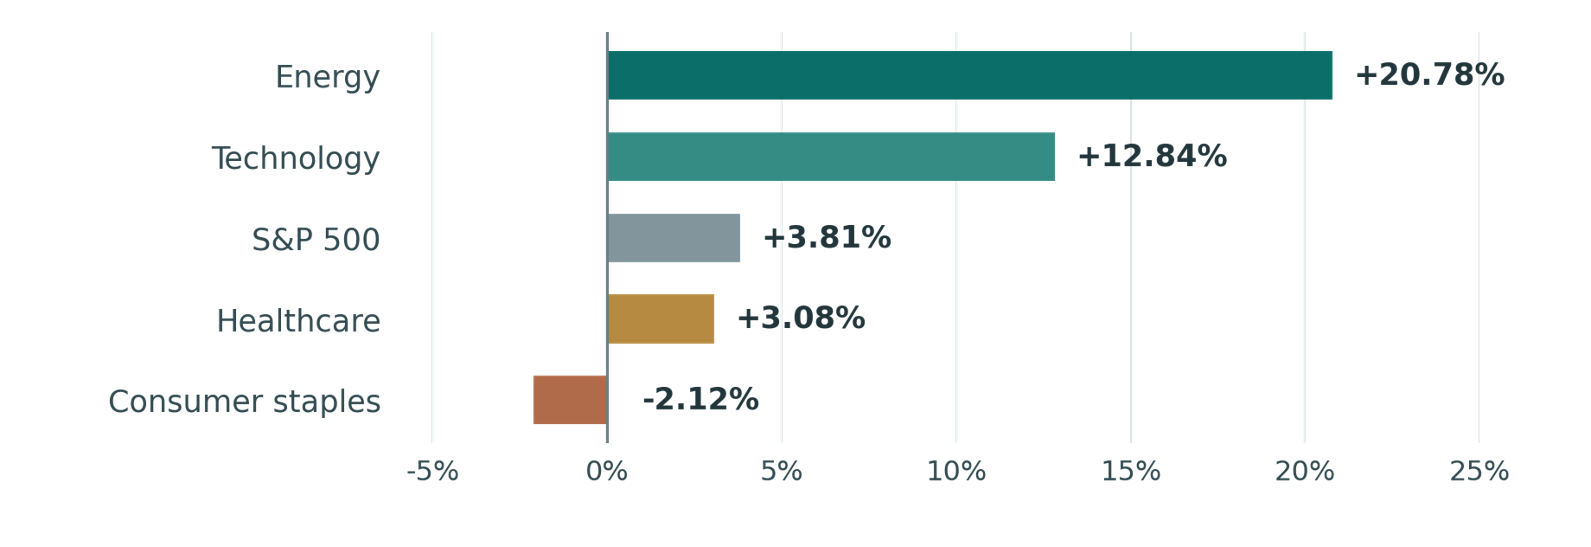
Emerald Asset Management FactSet sector watchlist, October 6, 2026, about 3:31 p.m. Eastern. Rolling three-month price changes, excluding dividends; intraday readings could change by the close.
We also look for confirmation outside the headline index. Classical Dow Theory compared industrial shares with transportation shares: if producers were strong but the companies moving their goods were not, investors had reason to examine the divergence. In this AI-led market, we ask a related question of semiconductors. If the S&P 500 keeps making highs while chip stocks repeatedly fail to follow, especially as fewer stocks participate and yields rise, we would become more cautious. One disagreement is a clue. A pattern across several measures carries more weight.
The Fundamental Test: Will The Spending Hold Up?
Large technology companies are building data centers at a remarkable pace. Alphabet, Microsoft and Amazon are among the largest hyperscalers by market value; our capex model also tracks Meta and Oracle. The latest supplied estimates put their combined calendar-2027 capital spending at about $1.072 trillion, 22.6% above the model’s rolling 90-day comparison. That is a powerful signal of demand for chips and the equipment around them, and we examine it in Part 2.
What we are watching now is the direction of the revisions. A slowing pace of increases would get our attention before outright cuts arrive. If estimates flatten or fall across several customers, and chip orders weaken at the same time, we would reconsider how much risk to take in the theme.
A Bull Market Still Needs A Risk Plan
Our long-term view remains constructive, but the bear-market stretches on the first chart are a reminder that secular bull markets do not last forever. We will not know ahead of time which cyclical setback becomes the start of something larger. The longer an advance goes on, the easier it is to confuse a bull market with brilliance. Investors should decide ahead of time how much stock exposure they can live with through a serious decline and limit the damage any one holding can do. If fewer stocks take part in the rally while rates rise, semiconductors weaken and hyperscaler spending estimates start coming down, we would have a reason to reduce risk. We can stay invested in the opportunity without assuming the current bull market will last forever.
Sources and timing: Shiller’s published stock-price series; user-supplied October 7 StockCharts close; selected observations from the shared interest-rate chart; October 6 FactSet sector snapshot; October 8 Reuters yield report; and the supplied October 8 hyperscaler workbook. The rate chart’s historical 2026 sample and the October 8 market quote are different observations.