Pullback, Correction or Bear Market?
People like using labels to describe stock market volatility. Generally speaking, most pundits describe a decline of less than 10% as a pullback, a decline of 10% to 20% as a correction and any decline greater than 20% as a bear market. If any of these events happen quickly they are usually referred to as a ‘crash’ or a ‘waterfall decline’.
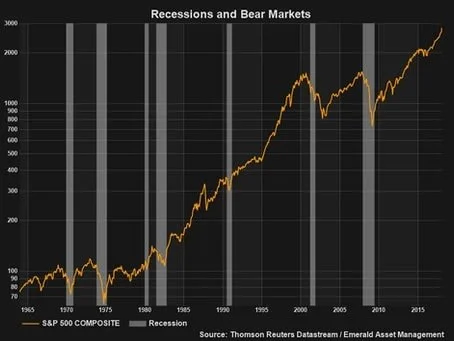
Since the mid 1960’s, most bear markets have been caused by or accompanied by recessions. In the chart below, one can see that the dips in US equities greater than 20% were generally associated with recessions. The two notable exceptions are the Crash of ’66 and the Crash of ’87. Therefore, if you don’t think the economy is headed for a recession then pullbacks and corrections should be considered as timely opportunities to selectively add to quality investments.
No Sign of a Recession Here
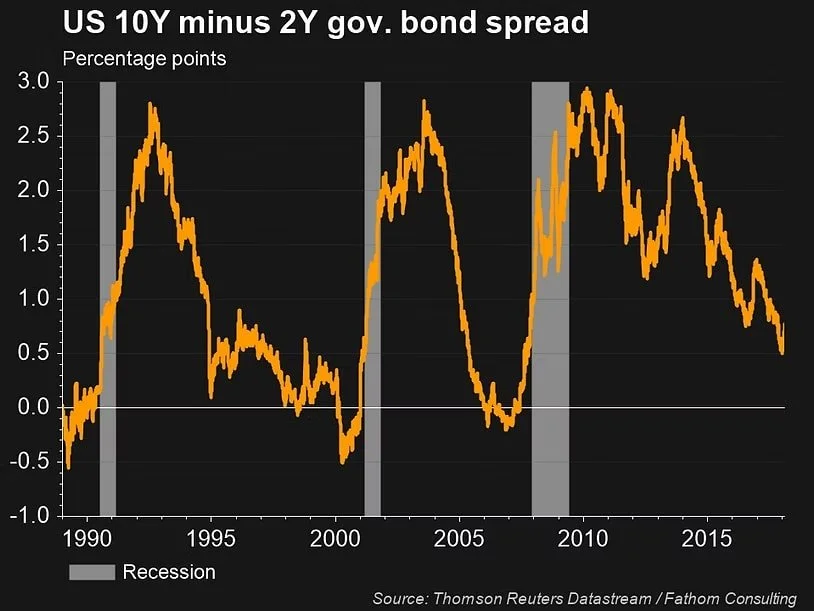
We don’t think a recession in the U.S. is eminent because the strong fundamentals underlying the economy. One of our favorite indicators for forecasting a recession is the spread between the ten-year treasury yield and the two-year treasury yield. Simply put, when short term interest rates go up, it is often a sign of tighter financial conditions in the economy. By the same token, when longer term interest rates go down, it is often a sign of lower inflation and / or slower economic growth. When short term interest rates are higher than longer term interest rates, the yield curve is said to be inverted because under ‘normal’ conditions, short term interest rates are usually lower than long term interest rates. Inverted yield curves have historically lead recessions by six to eighteen months. The chart below shows that while the yield curve has flattened since the Great Recession, it isn’t close to inverting. Even if it were to invert, remember that generally the yield curve has inverted and started to normalize well before the onset of a recession.
Watch out for the Last Hike!
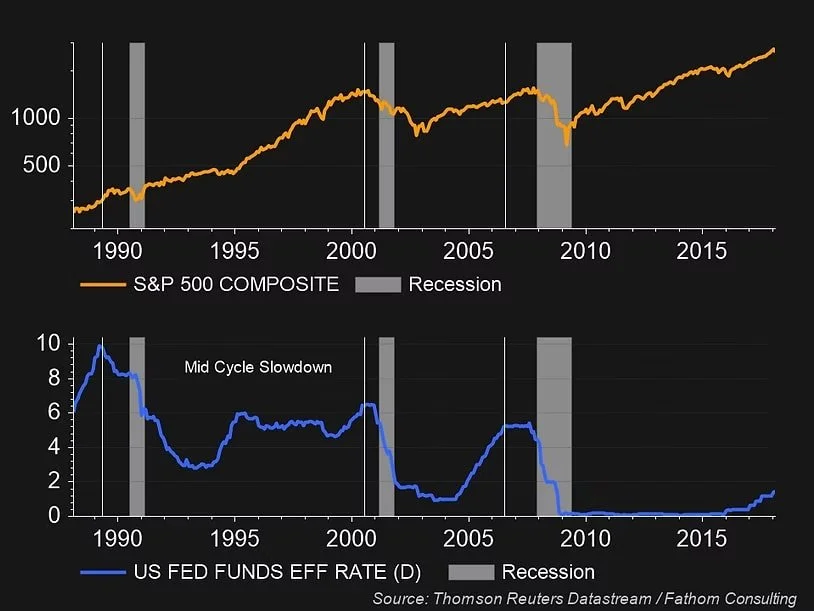
Another notable observation is that recessions tend to occur after the Federal Reserve stops raising short term interest rates, not when they start raising interest rates. So, if you think the Fed is through with this tightening cycle, that would be a reason to become cautious. However, the Fed has indicated that it would like to see the Target Fed Funds Rate at about 2.75%. Whether the economy can actually handle a 2.75% Fed Funds rate is open for debate but as of this writing the Target Rate is 1.50% and rate hikes have been coming in 25 basis point increments. Therefore, we don’t think we have seen the last hike.
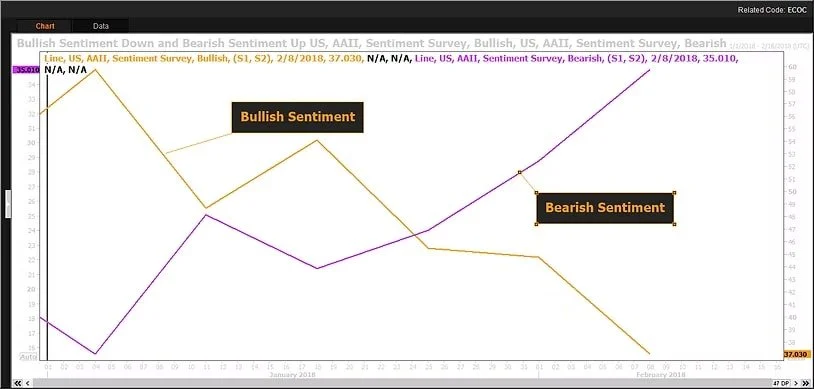
More Bears and Fewer Bulls makes for a Healthier Market
One positive that has resulted from the recent selloff is that valuations have come down closer to their long term historical averages. Also, some of the pre-correction euphoria has come out of the market. (See the AAII Sentiment Chart since the beginning of 2018 below.) While we do think that the depth of the correction is at least somewhere near its bottom, we do think it will take some time to repair the technical damage done to the stock market. We also think the low volatility seen during 2017 is going to take a break for a while so be ready for a return to normality. Because we don’t think a recession is in the making, we think long term investors should use periods of volatility and weakness to their advantage by selectively accumulating quality stocks.