Second Quarter Review

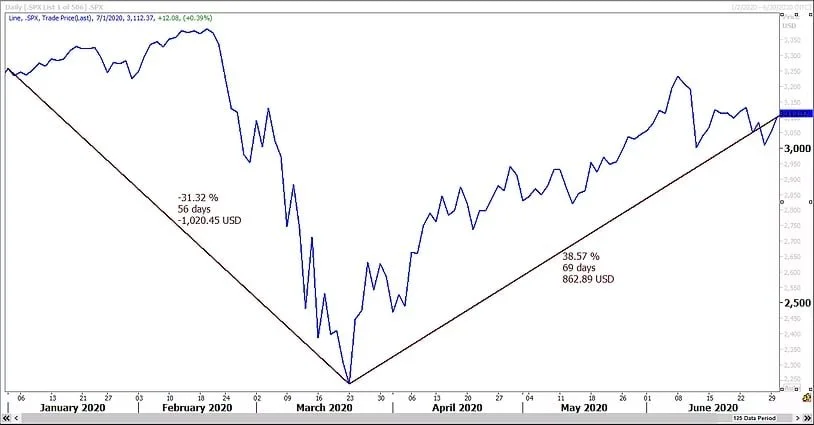
Somehow it just doesn’t feel like the S&P 500 had its fourth best quarter since 1950, but it did. The S&P 500 started this year at 3244.67 and closed out the second quarter out at 3100.29. That translates into a year to date loss of 4.45%. But the second quarter returned a massive gain of 19.95%. Dividends helped make the YTD total return closer to break-even and pushed the second quarter total return over 20%. It always surprises me that people think they know what the future holds and when to expect it. Nobody saw the Corona Virus related selloff coming and certainly not the ensuing rally. And everybody expected a retest of the March 23rd lows which never materialized. The point is that investors need to expect volatility like we’ve recently witnessed from time to time and know that they usually can’t anticipate what will cause it or when it will happen. As they say on Wall Street “the snake you see ain’t the one that bites you.” So in our opinion most retail investors should just pick their asset allocation and stick with it. We do believe that there are times when it makes sense to play offense and there are times when investors should be more defensive at the margin though.
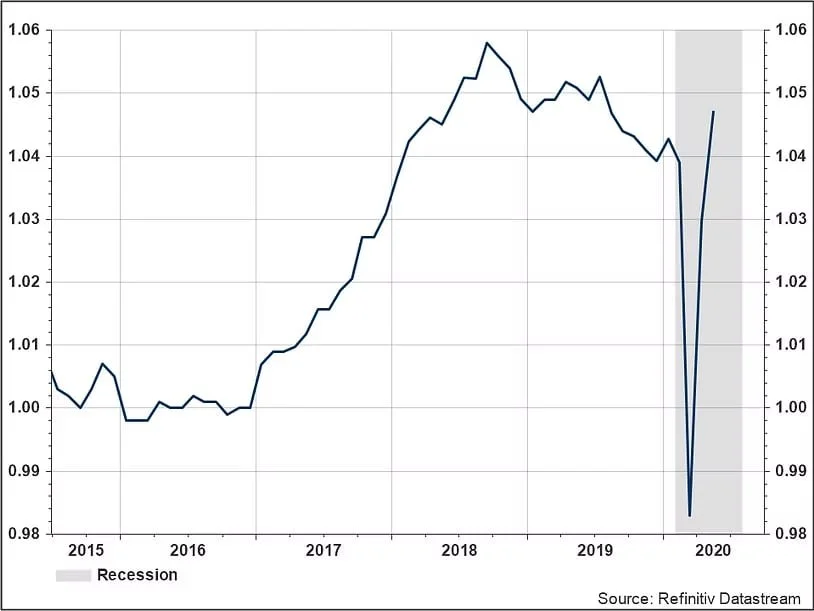
We think that, at least for now, the recession which briefly posted Great Depression like numbers is over. However, there remains an elevated risk of the rare double dip recession as the Pandemic takes its path to resolution. If the negative health related statistics continue to increase as they have been lately then we could see economic activity turn down again and stocks with it. But as of this writing the economic statistics are improving. On the next page we have included one of our favorite forward looking indicators, the Conference Board’s Leading Economic Indicators divided by the Index of Coincident Indicators. The rebound has been extraordinary but we’re not out of the woods just yet. Going forward, other concerns to keep in mind are China trade tensions and the upcoming election.
The Conference Board Index of Leading Economic Indicators divided by the Index of Coincident Indicators
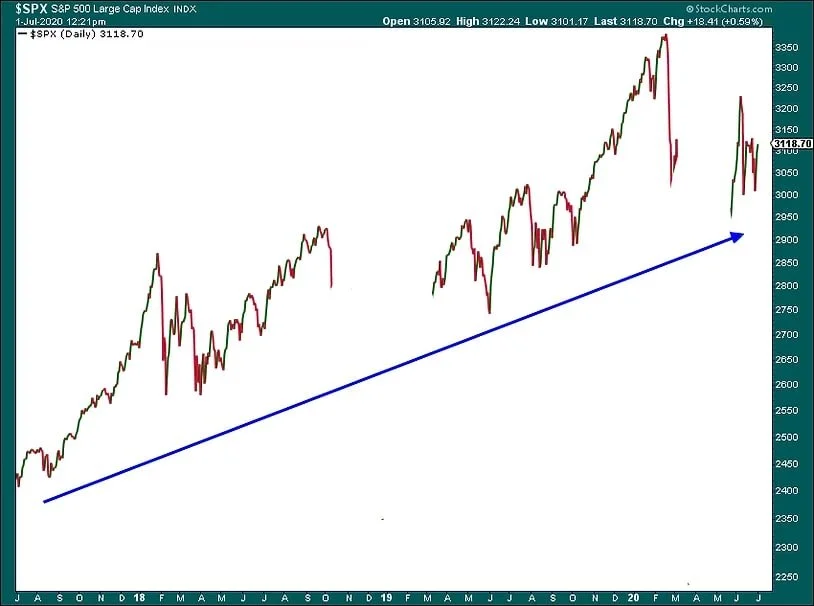
Volatility isn’t so bad if you just extend your time horizon and ignore the white space!