2017 Outlook - Predictably Unpredictable

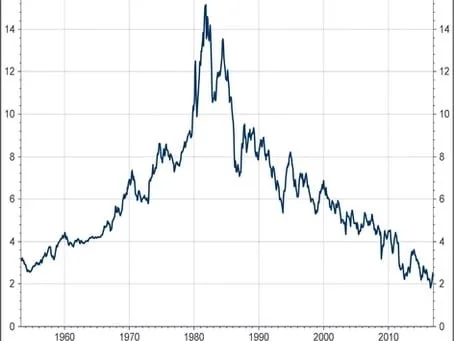
Chart 1
Anybody who has been in the investment business long enough knows the futility of forecasting financial events – especially when looking way out into the future. For instance, at this time last year who would have thought that Donald Trump would be our current president-elect, that the UK would have voted for the Brexit and that the price of crude oil would go from the low 30’s into the 50’s. Back when I used to be a stock broker, I remember reading a research report each year published by the famous quantitative analyst, Ed Keon, called “The Fearless Forecast”. The title was of course intended to be sarcastic.
But just because forecasting is difficult doesn’t mean that it shouldn’t be attempted. If one doesn’t have a basic understanding of the current economic and investing landscape or any expectations about the future then there is no basis for making investment decisions. As the facts and events that play out in the coming year inevitably change from our base case outlook, we will certainly remain flexible and change our stance as the circumstances dictate. So for now, here is our view.
Key Calls
1) Inflection Point in Interest Rates and Inflation
We think that the long term bull market in treasury bonds that started in 1982 is over and that the US Economy is at an inflection point, not too dissimilar from 1950. Our Base Case is for the ten year Treasury bond yield to breach 3%, even if only temporarily. The all-time low for the benchmark was 1.336% in July of 2016 so that’s quite a move from the summer lows if it happens.
As economic growth continues to improve, we expect the Fed to implement a less accommodative monetary policy as fears of deflation turn to hopes of reflation. We expect a gradual pace of tightening out of the Fed and we do not expect that measured increases in the Fed Funds Rate will derail the current expansion. After the Great Recession, it appears to us that the Fed would rather be behind the curve than ahead of it. For the last two plus years the Fed has constantly jawboned about raising interest rates, but so far they seem to be moving at the snail’s pace of one 25 bps hike per year (Chart 2). While the pace of tightening will probably pick up, the Fed has lost credibility with us until their actions start to match their rhetoric.
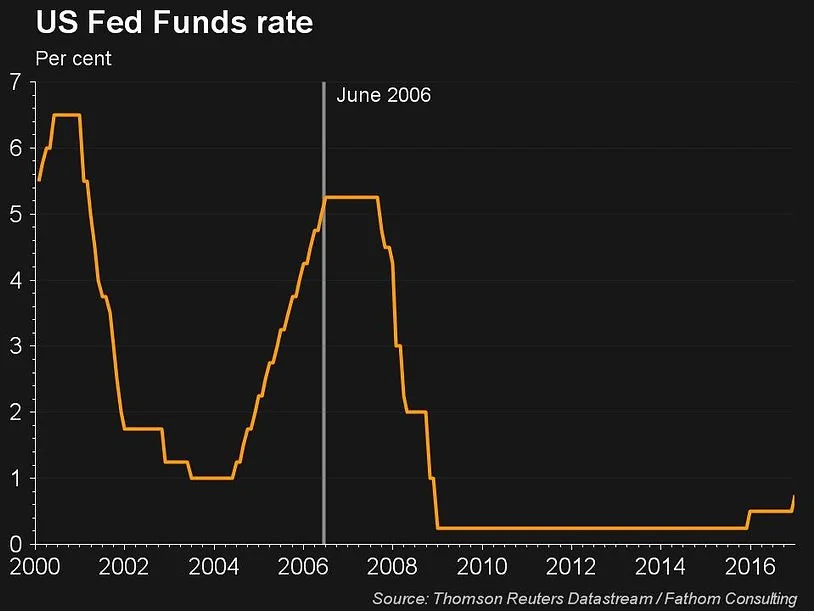
Chart 2
A bull market in bond prices typically requires falling interest rates while a bear market in bond prices is typically accompanied by rising interest rates (Chart 1). Since we think that the secular bull market in bonds is over, we want to be clear in our message. The message is simply that while we favor equities over fixed income, we do not think that investors should rush out and sell all of their fixed income holdings. Bonds can be an important part of an overall asset allocation strategy and they can provide inverse correlations with stocks and reduce volatility in a diversified portfolio. Our advice for fixed income investors is to simply understand that the interest rate environment could be changing and to understand and implement proper risk management techniques in order to mitigate interest rate risk in the bond allocation of their total portfolio.
2) The Next Leg of the Secular Bull Market is Probably Already Underway
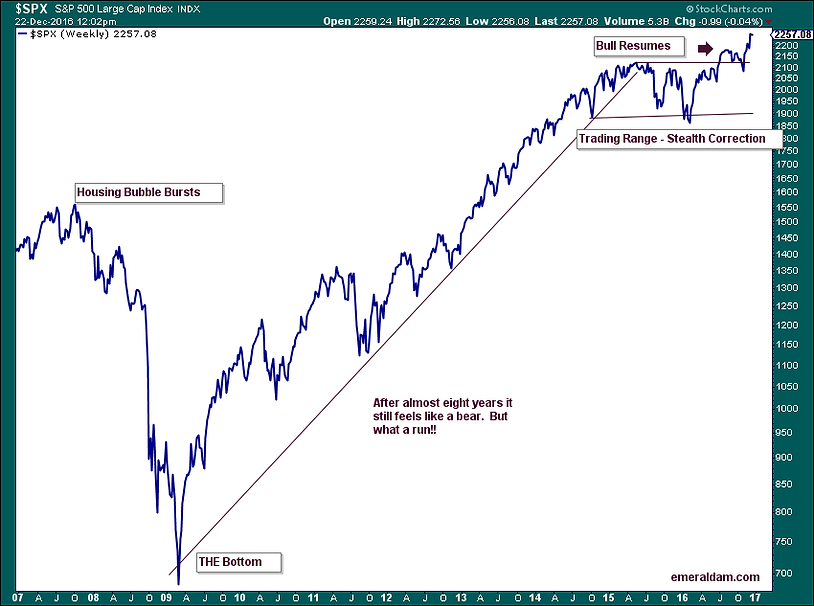
Chart 3
With the benefit of hindsight, what had to be one of the most hated secular bull markets in US stocks was born in 2009 out of the ashes of the housing market collapse. Secular bull markets typically last for 15 – 16 years and we are strong believers that the next phase of the bull market is underway. Since May of 2015 US Equities have been in what we have coined as a stealth correction which we view as a time out from the secular bull market – not a top out. Corrections can present themselves in several ways. Most retail investors fear either a sudden drop in stock prices (think 2007 – 2009) or a slow drawn out decline that takes years to resolve itself (think 2000 – 2003). But there is another way that stocks can correct their excesses. Sometimes markets will go sideways and wait out whatever economic problems are in the making. While the US economy has not met the traditional definition of a recession – two consecutive quarters of negative GDP growth – we believe that earnings in Corporate America did enter a recession from which it is currently emerging (Chart 4). Instead of collapsing along with earnings, stocks traded in a painful sideways range for nearly two years while waiting for earnings to rebound. Said differently, we think stocks have experienced ‘the stealth bear’ during this mid-cycle slowdown and we are now anticipating the next multi-year leg up for equity prices (Chart 3). Therefore, we recommend to our clients that they remain or get fully invested into equities within the context of their appropriate asset allocation.
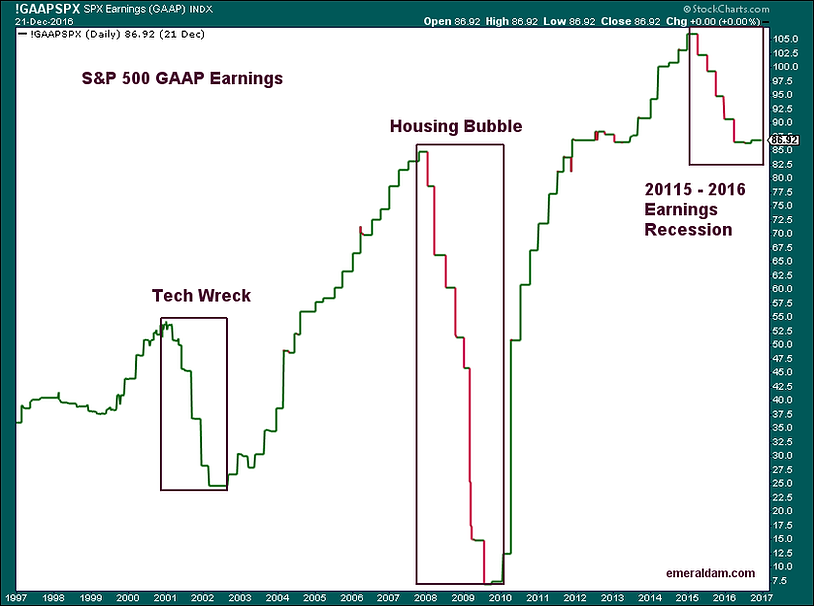
Chart 4
3) New Leadership is Starting to Emerge
One of the hallmarks of an emerging bull market in stocks is a change in leadership. After a long period of the out performance of growth stocks over value stocks, that trend appears to be reversing (Chart 5). Many of the glamour stocks have started to under perform some of the old line value names. As the character of this market has been changing, so has our advice and our investment posture. Please note that just because a stock has great or predictable earnings does not make it a bad investment - just like not all cheap stocks are great investments. The key is growth relative to expectations. We think that price paid relative to earnings that actually materialize will become more important in the coming years than simply high and / or predictable earnings growth. The reason for this possible change in leadership is that during a weak economy, investors are willing to pay a higher multiple for dependable earnings streams because earnings growth is scarce. But as economic growth strengthens, growth tends to spread out into the more cyclical and weaker value oriented names. It's just another example of the basic irrefutable law of supply and demand. We expect the next cycle up to be earnings driven rather than liquidity (Fed) driven.
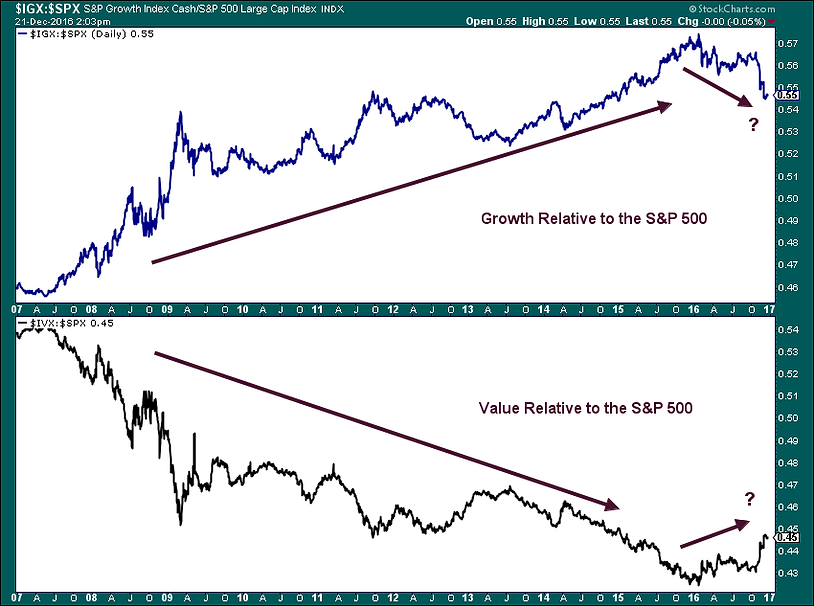
Chart 5
Also of note, it appears that the out performance of Small Cap stocks relative to Large Cap stocks has resumed (Chart 6). The continuation of this trend is important because Small Caps often lead in strong bull markets.
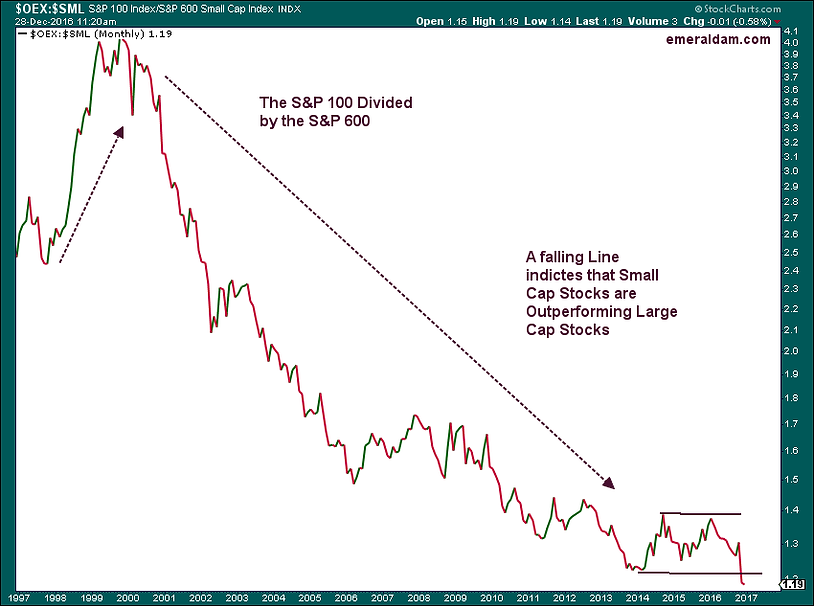
Chart 6
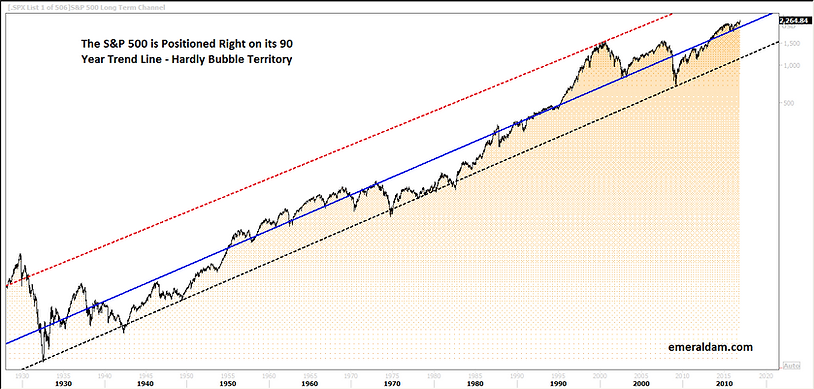
Chart 7
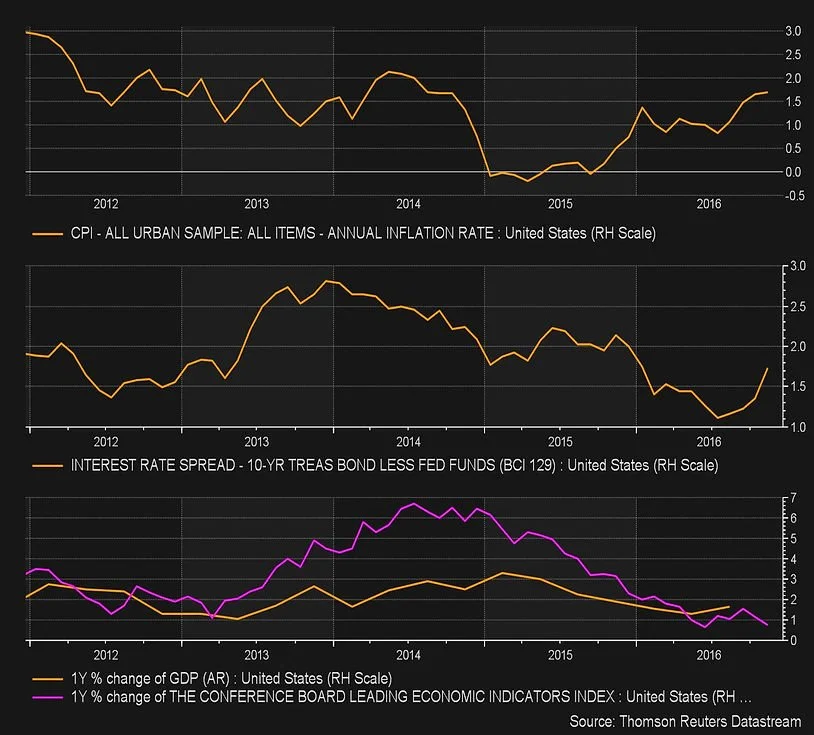
4) No Recession on the Horizon
We don’t see the hallmark signs of a recession on the horizon. Inflation is currently under control which should keep the Fed talking more than acting, the yield curve is positively sloped, and GDP and the Leading Economic Indicators are weak but positive.
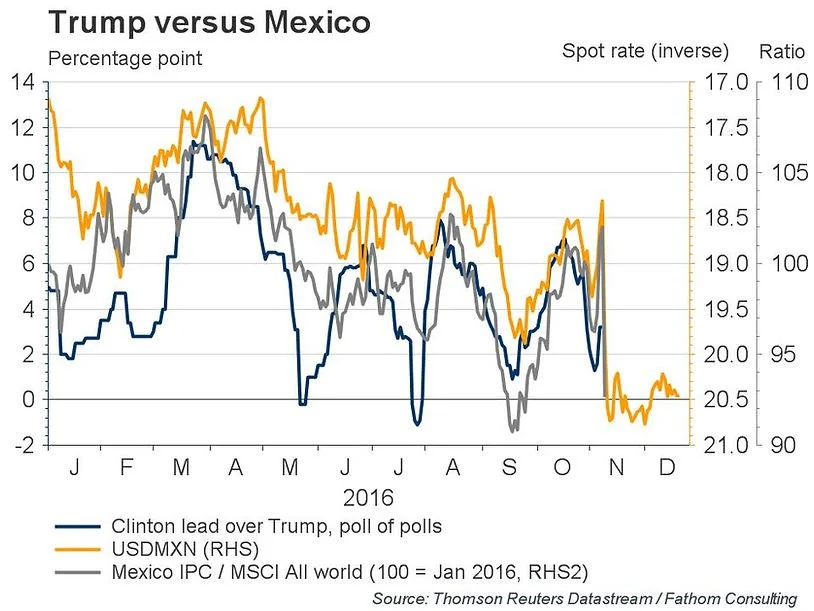
5) Orange Swan Events
In addition to the usual litany of geopolitical events, natural disasters and currency issues as well as positive economic data points and positive earnings surprises, we think that there are new uncertainties and opportunities in the capital markets. Of course we are referencing the surprise election of Donald Trump. As we wait for January 20th for (the real?) Donald
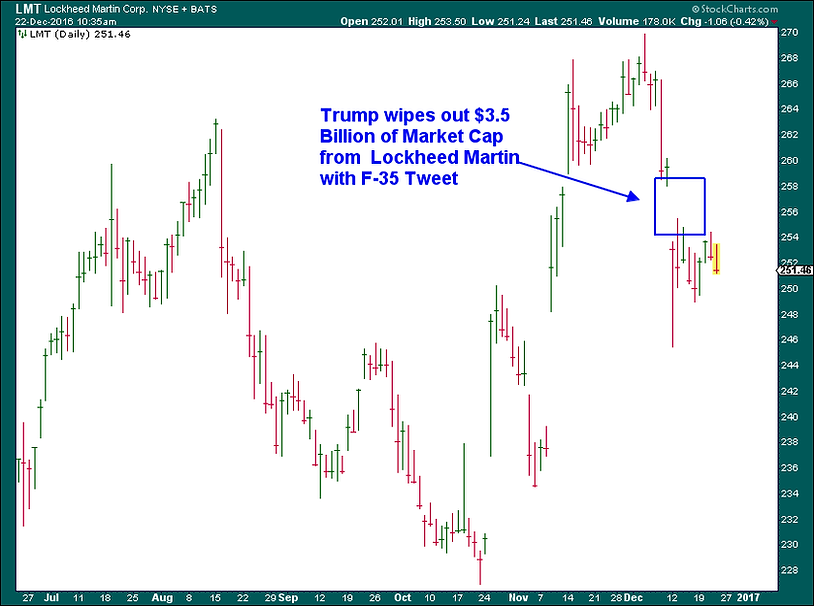
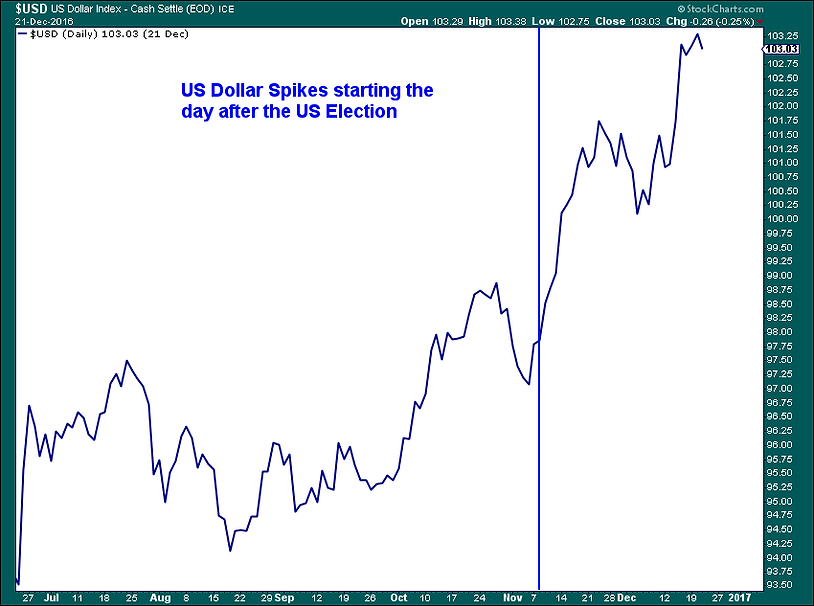
Trump to step forward there are opportunities and potential problems that could arise. For example, tax cuts could be great for the consumer and for the economy. But will tax cuts lead to higher budget deficits? Will Trump be forced to fight against the Republicans and the Democrats to get policies implemented or is gridlock on hold for now? Will your favorite stock become the next victim of Twitter-gate? The simple fact is that although we are firmly in the bullish camp, there will surely be winners and losers as policies are proposed and passed or voted down. While we really don't expect that President Trump will attempt or even be able to implement many of the policies that he floated during the campaign, the biggest known unknown that we see is the potential for trade wars. Higher inflation could result from isolationist policies and trade wars which could lead to a much more hawkish Fed. That would be a negative for investors in our opinion.
However, as of this writing the trend is still your friend, the Fed and the political landscape are question marks and valuations can still be stretched higher. We are loyal to the trend if nothing else. Stay bullish my friends.
Some Examples of Orange Swan Events before the Actual Inauguration