Is the Stock Market Really Overvalued?
With the strong bull run in stock prices since November, we have been reading more from the perma-bear community about how overvalued the stock market is. With optimism running high among investors we think that a discussion of stock market valuations is timely. But before we get into the meat of the discussion, please understand that valuations are at best a blunt instrument for timing the market. Undervalued assets can become even more undervalued and overvalued assets can become even more overvalued.
Valuation metrics like P/E ratios, etc. are best used as caution lights or measures of risk in the markets and are most effective when used by investors as a piece of the overall puzzle, in our opinion. While we do use multiple valuation metrics when giving investment advice to our clients as part of our discipline, we think that the most important things to watch in order are: 1) the primary trend (most definitely positive), 2) monetary policy (we will believe that the Fed is tightening when we see it since they have been jawboning for years) and 3) valuations in conjunction with sentiment. With sentiment being elevated US equities might be overdue for a correction. Corrections can and will happen even in the best of times so expect them. But there is a big difference between a correction and a bear market. Corrections cause heartburn - bear markets can cause permanent financial damage. With the information that we have today, we have no basis to say that the bull market that started in 2009 is over or even nearly over. We do think that until this recent run, the secular bull market had been experiencing a mid-cycle slow down since the summer of 2014 but that appears to be behind us for now as the earnings recovery has started to drive the bull market versus the recent past when the Fed was driving the bull market.
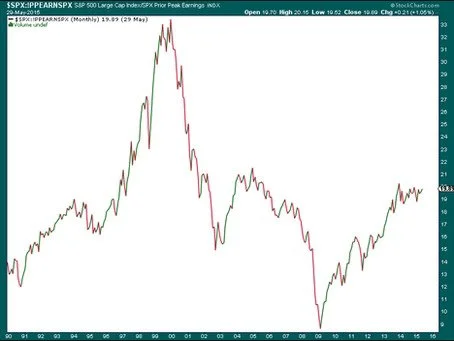
On to valuations: There are many ways to measure whether an asset or a market is potentially undervalued or overvalued. The first chart shows price to peak earnings. The price to peak earnings ratio is simply the stock market price divided by the highest level of reported earnings. This can be a useful measure of valuations because when earnings drop P/E ratios will go up, all else being equal. Therefore the market can look expensive if earnings (the E in P/E) drop by more than the price. This valuation method corrects for that. As you can see in chart 1, multiples have risen since 2009 but they are nowhere near the bubble levels of the tech boom.
Chart 1
The Price to Peak Earnings Ratio looks at the ratio of the price of an asset to something that has already been reported (earnings) and it is important to remember that the stock market is a forward looking mechanism. So investors are placing their bets today based on what they think the future holds. If earnings continue to recover and if interest rate changes remain relatively muted then stocks can go much higher, in our opinion.
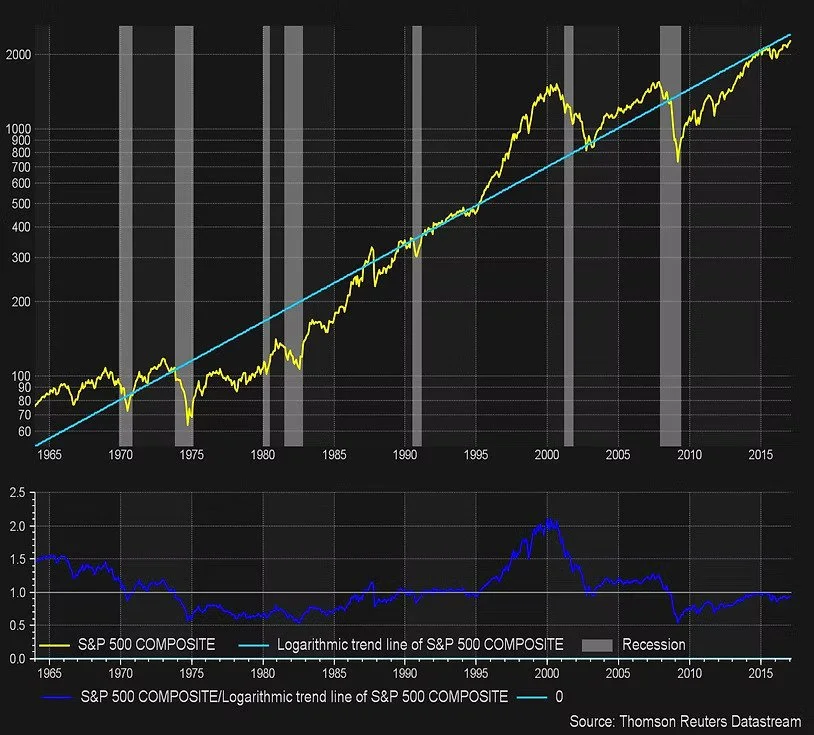
The next chart shows the S&P 500 relative to its trend line going back to December 31, 1963. We also monitor a similar chart going back to 1928. Because the trend line (statistical midpoint) will change as data is added to or taken away its important to look at the trend over different time periods. For a longer term view please see chart 7 in our 2017 Outlook by clicking here. The basic take away is that US Equities are either slightly below or possibly only slightly above their long term trend, depending upon the time frame chosen.
Chart 2
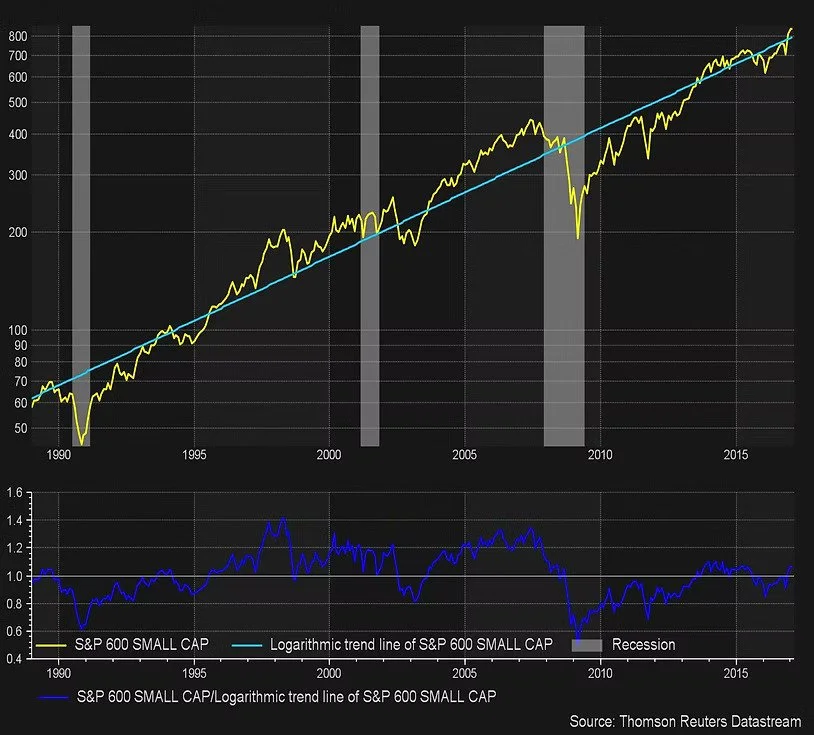
The same basic observation can be made with a glance at small cap stocks as measured by the S&P 600 below. While prices have risen, they are not at euphoric levels, in our opinion.
Chart 3
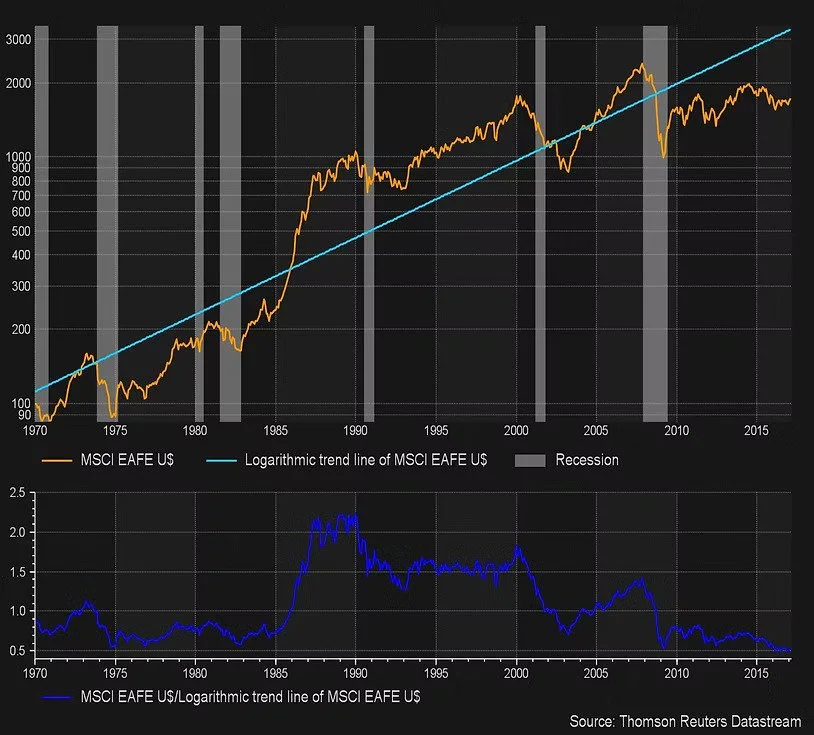
Okay, if fair value isn't cheap enough for you, you might want to take a look at some of the developed international stock markets. The MSCI EAFE is trading at about a 50% discount to its trend line dating back to February 27, 1970. Maybe a picture really is worth a thousand words.
Chart 4
While we are firmly in the camp that US equities are in a secular bull market, the point of this missive is not to tell you where we think the stock market is headed. The point is that there are as more ways to attempt to determine whether the US Equity Markets (and global markets for that matter) are overvalued and we don't think they are. Furthermore, valuations are only one variable in the equation. So if you read a negative article predicated on valuations or if you are concerned and thinking of selling your stocks based on the recent market strength, remember corrections are always going to be part of the investing game. But we think the real money will be made by staying fully invested in the bull market while it lasts.


