2019 Mid-Year Outlook

Congratulations, you just made it through another bear market! We think the cyclical bear is heading back to his cave and that the secular bull will soon resume its charge. We have written many times that we believe that a secular bull market began in 2011 which was the valuation low of the previous secular bear market while the price low occurred in 2009. Having said that we have appropriate risk management strategies in place to increase our clients’ odds for success in the event that we are wrong.
In the short run, two emotions always rule markets – fear and greed. We all saw a great example of fear ruling the stock market as the S&P 500 dropped over 20% during the 4th quarter of 2018 followed by greed taking over as the S&P 500 rewarded patient investors with two great back to back quarters. In the long run, we believe that earnings are the primary driver of stock prices. Since earnings are ultimately derived from the economy, the real question is “how is the economy doing.” The Emerald Asset Management base case is that there will be no recession for the next six to twelve months. Recessions are notoriously difficult to forecast so we don’t plan to go on the fool’s errand of predicting the unpredictable. However, in the charts that follow we will attempt to show readers a condensed version of the lens through which we view current market and economic conditions because if you don’t know what’s currently happening then it’s difficult to form an investment thesis.
Chart 1
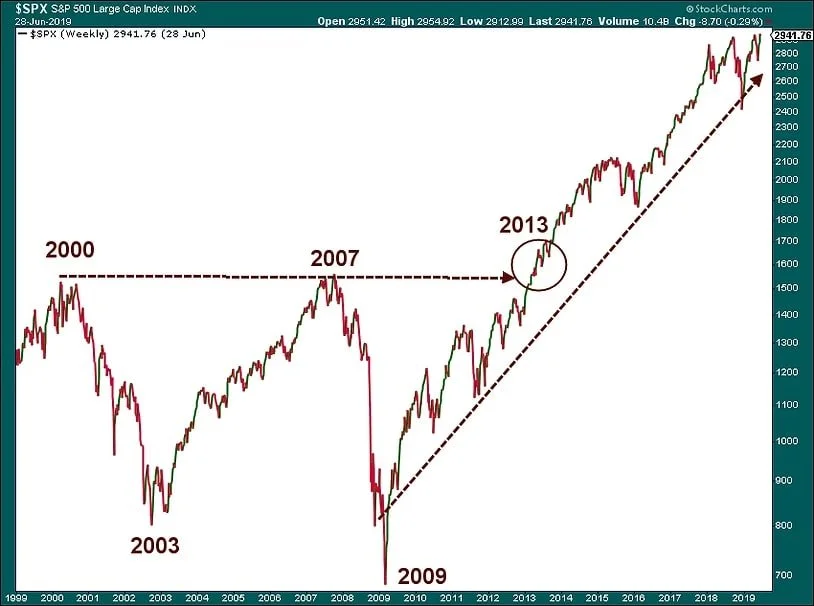
The first chart (Chart 1) is of the S&P 500 illustrates the secular bear market that encompassed the infamous Tech Wreck and the Great Recession. In 1998, cracks began to appear in the armor of the great secular bull market of the 1980’s and 1990’s. The cyclical bear market from 2000 to 2003 issued in a new period of pain for investors as the secular bear market made its presence known. After the housing crisis sunk stocks, we think the secular bull actually resumed in 2011. And it wasn’t until 2013 that US stocks made new highs. Think about that for a second. Stock market pundits and talking heads seem to relish terms like ‘long in the tooth’ or ‘late cycle’ as they insinuate that age will be the reason for the next secular bear market. But stocks only made new highs about six years ago and the secular bull market is only about eight years old in our opinion. Secular bull markets as we count them here have historically lasted about fifteen to sixteen years. Anecdotally the current economic expansion in Australia is about twenty-seven years so don’t fall for the time trap. Watch the economic indicators.
Chart 2
So what will kill the bull or at least cause another major correction? Generally there are two things that hurt stocks for more than a quarter or so. The first thing is a recession and the second is inflation. Because we want to keep this missive as short possible, we will focus our words on what has investors most spooked. We think most of the perceived risk in stocks today is tilted toward recession concerns.
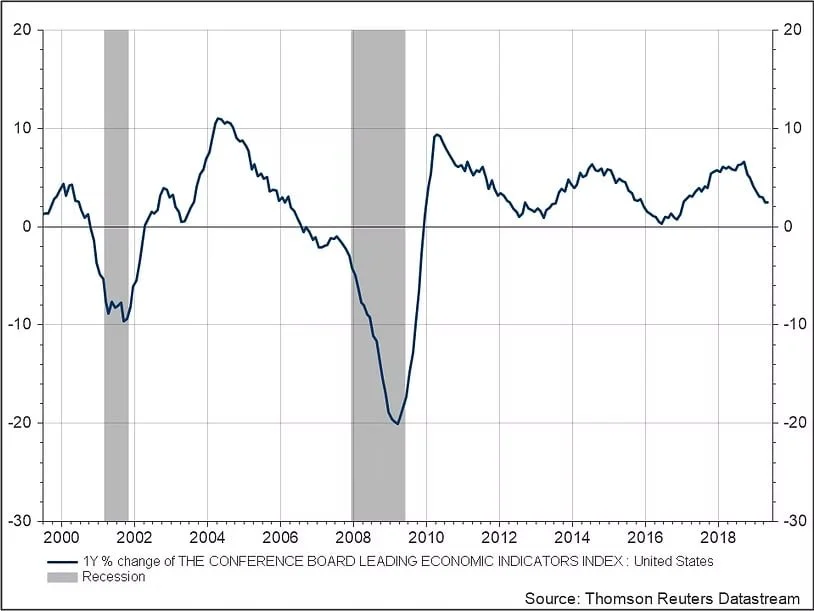
Economists and the press tend to throw out lots of statistics for investors to digest. The easiest way to think of all of these data points is as leading, lagging or coincident indicators. One of the easiest indicators to digest is the index of leading economic indicators. The Index of Leading Economic Indicators (LEI) is actually ten data points that are combined to form an index that tends to turn up or down before the economy does. The chart of the LEI shows that while conditions have deteriorated some, the economy is still growing. The gray bars mark previous recessions. (Chart 2).
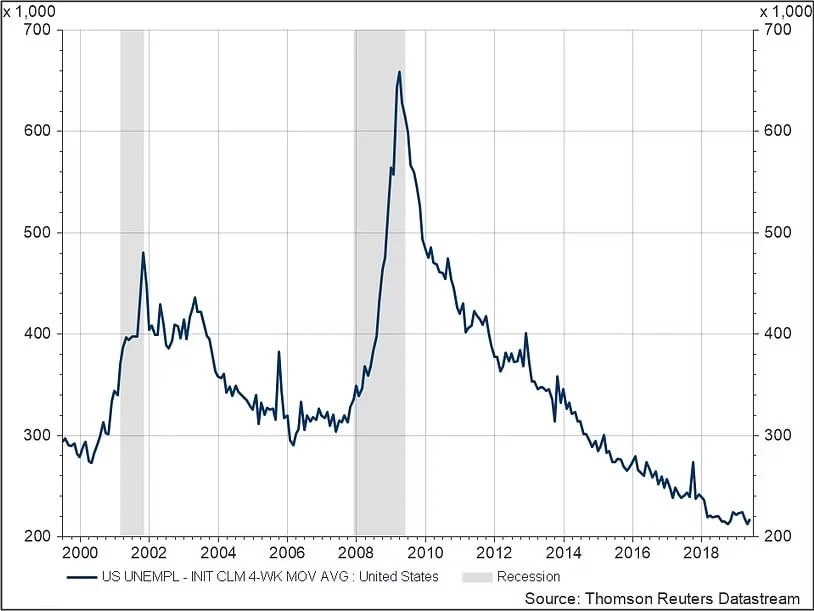
Weekly Jobless Claims are a good example of a Leading Economic Indicator. The Claims numbers have been trending lower since 2009 and they haven’t been this low since 1969! The only real question that we have is “is this as good as it gets?” Time will tell. (Chart 3).
Chart 3
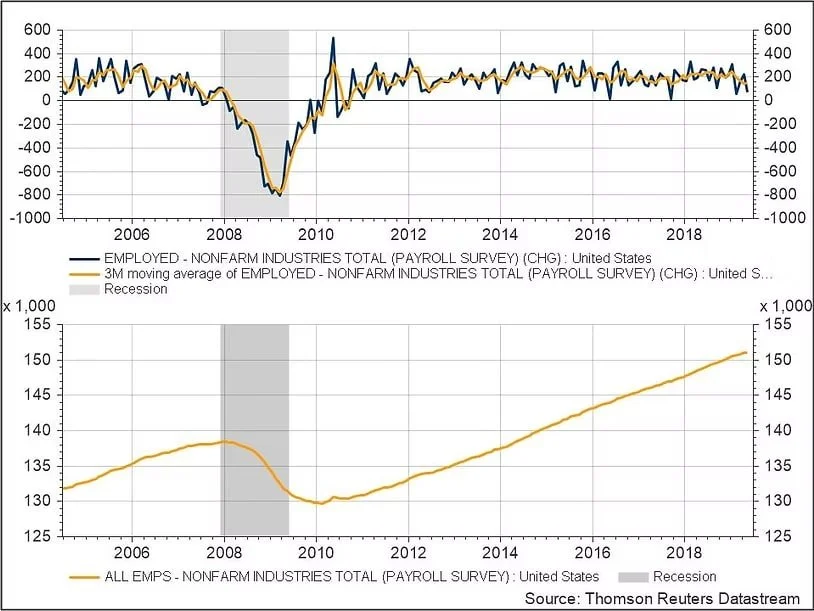
While Jobless Claims tend to lead the economy, the Non-Farm Payroll Numbers are Coincidental indicators meaning that instead of anticipating economic activity, they tend to show what is happening to economic growth in real time. Like the Index of Leading Economic Indicators, there appears to be some softness in the economy but no real signs that the US economy is actually in a recession right now. (Chart 4).
Chart 4
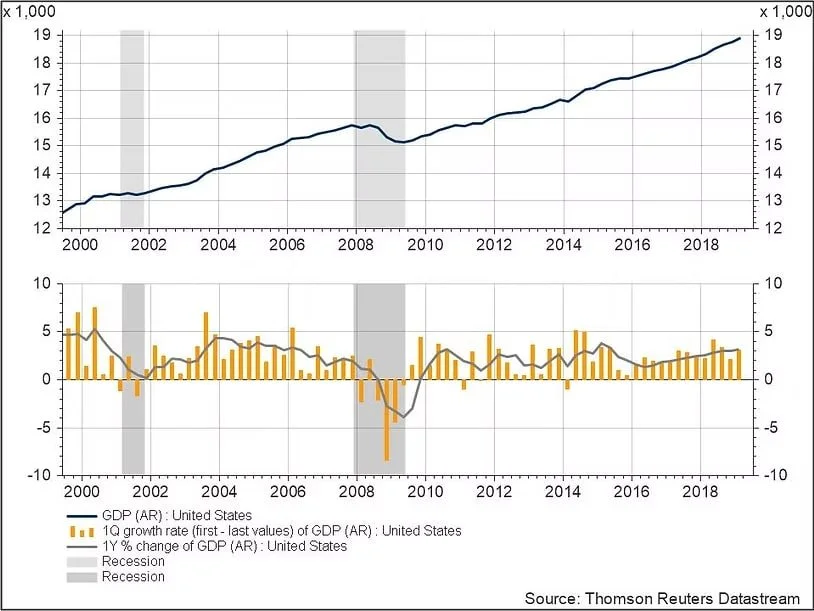
Since we are trying diagnose the health of the US Economy, it makes sense to directly measure it. Chart 5 shows that US Gross Domestic Product (GDP) appears to be robust. One drawback of relying strictly on the actual number used to measure the economy is that it is subject to multiple revisions so other indicators that help to confirm the initial releases like the Payroll Numbers can be helpful.
Chart 5
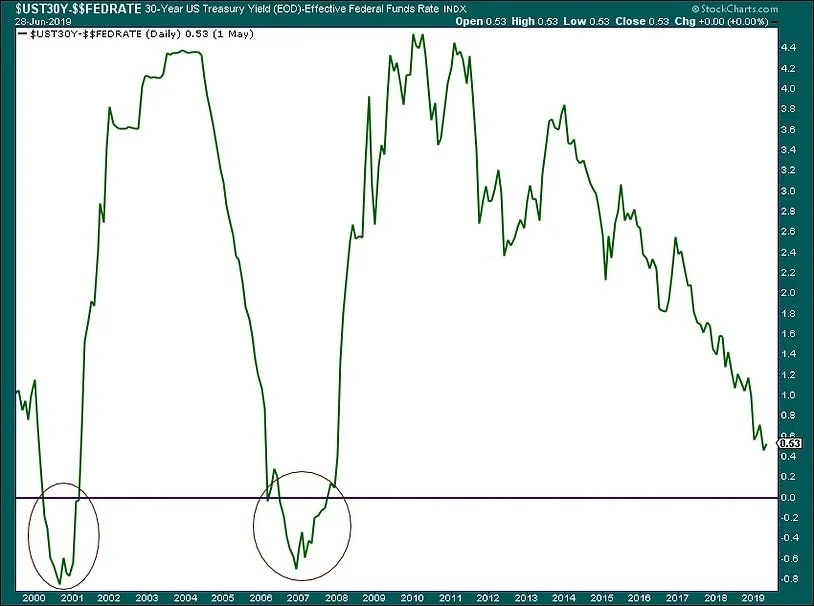
So why worry? Well, there are two known unknowns that shouldn’t be overlooked that could cause economic and capital market turbulence ahead. The first item is headline risk pertaining to trade. We think that it is imperative that the Trump Administration work out its differences with China this year. We think some of the softness illustrated in the previous charts is directly related to trade concerns. Handicapping political events is difficult enough and even more so in the current environment. We’ll rate this risk as a toss up but for now we remain optimistic. Item two on our list of concerns is the possibility of a policy mistake by the Federal Reserve. We don’t want to pretend to be as smart as the Federal Reserve but past Federal Reserve boards have pushed tightening cycles two far. A sign that the Fed has gone too far in raising interest rates can be when short term rates, which are determined largely by the Fed, are higher than longer term interest rates which are more economically driven. When this relationship occurs the yield curve is said to be inverted. Many parts of the yield curve have already inverted but we think market participants are focusing on the wrong part of the curve. We think investors should focus on the difference between the Thirty-Year Treasury Rate and the Fed Funds Rate. As can be seen in our last chart, that yield curve has not yet inverted. Furthermore the Fed has assumed a more dovish posture lately. We are expecting one rate cut this year while the markets are currently discounting two rate cuts.
In conclusion, it is the position of Emerald Asset Management, Inc. that the current softness in the economic indicators is transitory. We think that one interest rate insurance cut plus positive news flow on trade should start the next leg up for the current secular bull market. After all, US equities haven’t made any progress for seventeen months and bull markets tend to surprise on the upside. Stay invested but always employ proper risk management strategies.
Chart 6