Not Making Money in Stocks? Here's Why
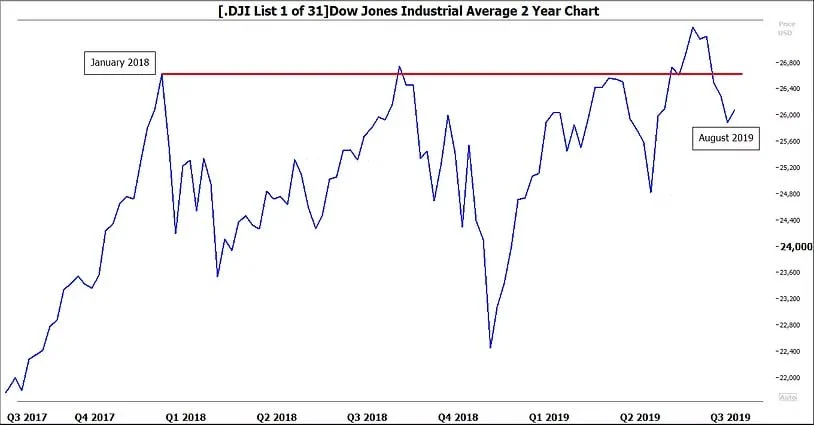
If your 401(k) feels flat there's a reason. A quick glance at the chart below shows that the Dow Jones Industrial Average is below its January 2018 highs. That's right - US equities as an asset class have made virtually no progress for over a year and a half.

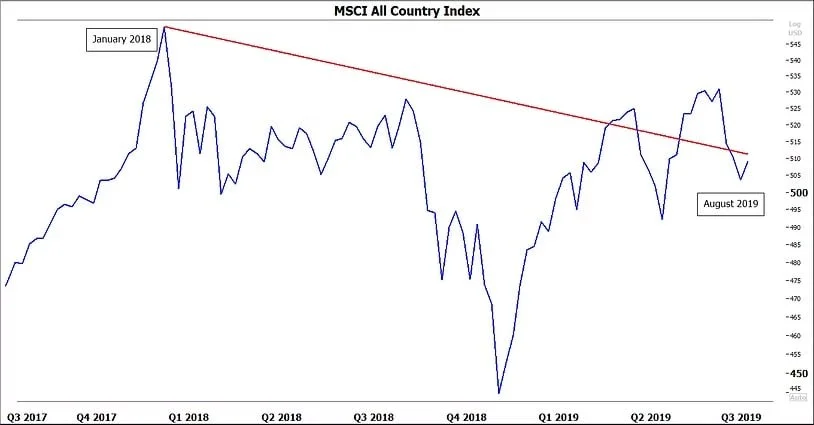
And the picture is even worse if your are globally (properly) diversified!! The MSCI All Country World Index which includes US and Global Equities is well below the January of 2018 mark.
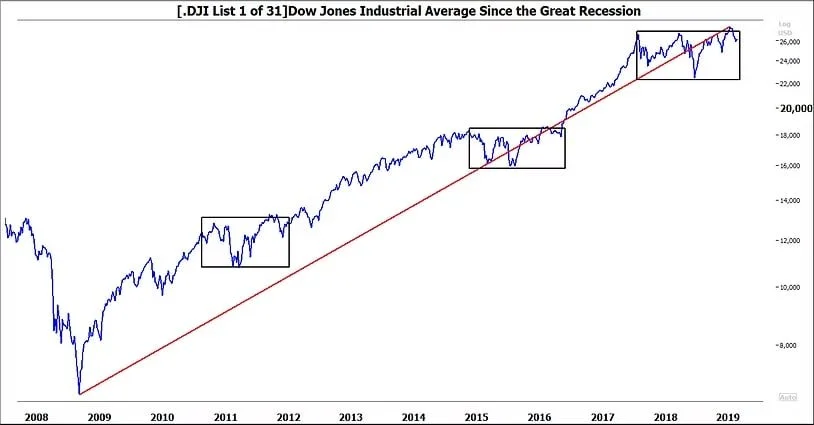
But...we think the secular bull market that started after the Great Recession is still alive and well. In our twenty eight years of experience we have found that major tops are generally not associated with fears of Trade Wars and Inverted Yield Curves. So our advice is to remain patient, stay diversified and properly allocated and wait for the next leg up.
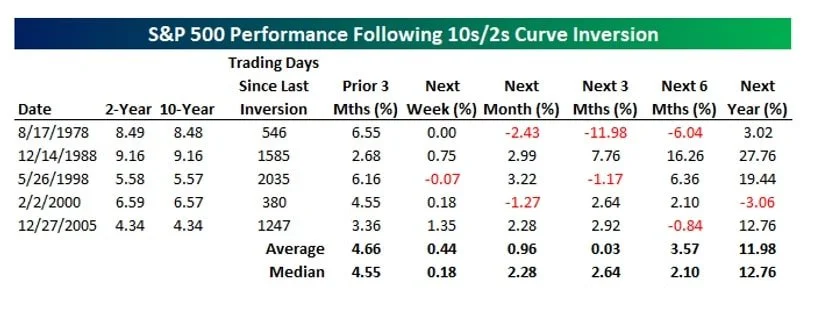
According to Bespoke Institutional, the track record for the S&P 500 has been fairly good looking out twelve months after an inversion of 10 year and 2 year treasury rates. The inversion of that part of the yield curve is what has sent the financial press into such an uproar. Over the last forty plus years. here have been five such events. The average twelve month return following these occurrences has been 11.98% with only one negative outcome and that was only -3.06%.