Seeing the Market Clearly: How Relative Strength Guides Smarter Investment Decisions

Strong performance isn’t always obvious at first glance. But with the right lens, you can see where trends are quietly taking shape. Relative strength helps investors do just that—by comparing performance across assets to uncover consistent momentum.
At its simplest, relative strength measures how one investment is doing compared to another. It’s most commonly used to evaluate how a stock or asset class stacks up against a benchmark, like comparing the performance of a technology stock to the S&P 500. When an investment steadily outperforms its benchmark or peers, it’s considered to have strong relative strength.
Importantly, this approach isn’t about reacting to headlines or chasing short-term price moves. Relative strength highlights persistent performance trends, helping investors see where momentum is gaining traction—and where it may be losing ground. It’s a practical tool for making more informed, objective decisions in a noisy market.
Why Relative Strength Matters
Markets are always in motion—rotating between sectors, asset classes, and styles. Relative strength provides a way to stay aligned with what’s gaining ground and avoid areas losing momentum. It’s a disciplined, evidence-based approach that removes emotion from the equation.
Spotting Strength at the Asset Class Level
Relative strength is a useful tool for determining where to allocate capital across major investment categories, like U.S. equities, international markets, bonds, commodities, or alternatives. If U.S. large-cap stocks are consistently outperforming emerging markets, for example, that might justify a strategic tilt toward U.S. equities.
This becomes especially valuable during times of macroeconomic change. As inflation trends shift, interest rates adjust, or global growth forecasts evolve, leadership among asset classes often changes. Relative strength helps identify those transitions early, so portfolios can adapt proactively, not reactively.
Focusing in at the Security Level
Within an asset class, relative strength helps pinpoint which stocks, sectors, or ETFs are outperforming their peers. The goal isn’t to chase returns; it’s to identify sustained leadership backed by data. Research shows that top-performing investments often continue to show strength over time.
Take a tech-driven rally, for instance. Relative strength helps isolate which tech stocks are gaining traction and which ones are simply riding the wave.
How We Use Relative Strength at Emerald Asset Management
At Emerald Asset Management, relative strength is a key part of our top-down analysis. Before selecting specific securities, we start with a broader question: Where is capital being rewarded right now?
This means looking at major asset classes, sectors, and regions—and measuring how they’re performing relative to one another. We believe this approach helps us stay aligned with leadership trends, rather than anchored to outdated assumptions.
A Potential Turning Point in Global Markets
For well over a decade, U.S. equities have dominated global markets. Large-cap U.S. companies—especially in technology and consumer sectors—have delivered strong returns, while most international markets have lagged behind. As a result, many investors have understandably concentrated their portfolios in U.S. stocks.
But relative strength doesn’t just tell us where we’ve been—it gives clues about where we might be going.
Today, we’re seeing early signs that international markets may be regaining leadership. Regions like Japan and parts of Europe have started to outperform U.S. stocks on a relative basis. While this doesn’t confirm a long-term trend yet, it’s a signal we’re watching closely.
Relative Strength Chart: International Markets vs. S&P 500
The two charts below show how developed international markets (measured by the MSCI EAFE Index) and emerging markets (measured by the MSCI EM Index) have performed relative to the S&P 500 over the past 15 years. In both charts, a rising line indicates periods when U.S. equities outperformed, while a declining line signals stronger relative performance from international markets.
S&P 500 vs. MCSI EAFE 2001-2025
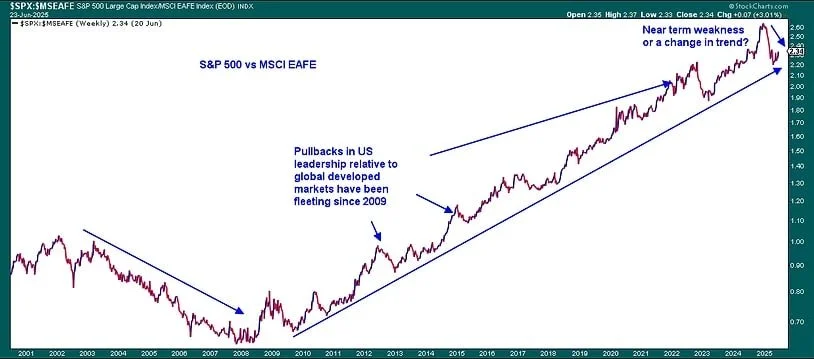
Source: StockCharts.com. Data as of 6/23/2025.
S&P 500 vs. Emerging Markets 2001-2025
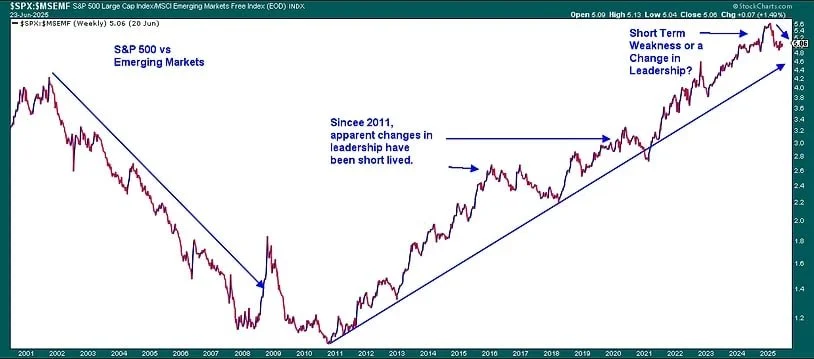
Source: StockCharts.com. Data as of 6/23/2025.
While we’re beginning to see early signs of improvement outside the U.S., it's still too early to declare a full shift in leadership. Rather than suggesting that international markets are set to take the lead, we believe a more likely scenario is that the rest of the world is playing catch-up to the U.S. after a long period of lagging returns.
If that’s the case, we would interpret it as a healthy development for both the stock market and the global economy. It would expand the opportunity set and support a shift from an underweight stance in international equities to a more neutral or balanced allocation. This isn’t a call to chase returns abroad—but a reminder that staying diversified helps position portfolios to participate as new regions begin contributing more meaningfully to global growth.
As always, we’ll continue to monitor the data and adjust as evidence builds.
A Broader Lens: How We Combine Tools for Smarter Decisions
While relative strength is a powerful tool, it's not the only lens we use at Emerald. It helps us identify trends, but we also want to understand why those trends may be happening and whether they are sustainable.
That’s why we combine relative strength with:
Fundamental analysis – earnings growth, balance sheet strength, and valuation.
Macro indicators – interest rates, inflation trends, and fiscal policy shifts.
Other technical signals – trend confirmation, volume patterns, and key support/resistance levels.
Our goal is to build portfolios that are aligned with market leadership and grounded in sound fundamentals and thoughtful risk management.
By combining data-driven tools with real-world perspective, we aim to make informed, flexible decisions that help our clients adapt confidently, whether the shifts are happening within sectors, across regions, or across entire asset classes.
Want to better understand how we apply these strategies to real portfolios? Let’s talk. We’re here to help you navigate evolving markets with clarity, discipline, and a focus on what matters most to your long-term goals.
Emerald Asset Management is an independent, boutique Registered Investment Advisory firm based in Rocky Mount, NC, serving successful executives, business owners, and high-net-worth individuals across Raleigh, Durham, and Chapel Hill. As a fiduciary-led firm with over 30 years of experience, Emerald provides research-driven investment management and strategic financial planning. The firm specializes in individually managed stock and bond portfolios, alternative investments, and risk management strategies. With a disciplined approach and a commitment to clarity, Emerald helps clients navigate complex financial decisions with confidence. They can be reached at (252) 443-7616 or on the web at www.emeraldam.com.
The information presented is based on sources believed to be reliable and accurate at the time of publication, but accuracy and completeness cannot be guaranteed. The opinions expressed herein are those of Emerald Asset Management as of the date of publication and are subject to change without notice. This material is not financial advice or an offer to purchase or sell any product. This document may contain certain information that constitutes “forward-looking statements” which can be identified by the use of forward-looking terminology such as “may,” “expect,” “will,” “hope,” “forecast,” “intend,” “target,” “believe,” and/or comparable terminology. No assurance, representation, or warranty is made by any person that any of Emerald Asset Management’s assumptions, expectations, objectives, and/or goals will be achieved. Nothing contained in this document may be relied upon as a guarantee, promise, assurance, or representation as to the future. The S&P 500 measures the performance of the 500 leading companies in leading industries of the U.S. economy, capturing 75% of U.S. equities. A 10-year U.S. Treasury note is a debt obligation issued by the U.S. Treasury Department that has a maturity of 10 years. It is not possible to invest directly in an index. Emerald Asset Management is an investment adviser registered with the U.S. Securities and Exchange Commission. Registration does not imply a certain level of skill or training. More information about Emerald Asset Management's investment advisory services can be found in its Form ADV Part 2 and/or Form CRS, which is available upon request.