How the Election Could Affect Your Investment Portfolio
It seems that every election year the pundits bloviate on why this cycle is different than any other election year in history. It appears that the talking heads might be right this time. But before a long term investor wastes unnecessary energy worrying about the outcome and its unpredictable effect on stock prices, there are a few things that should be considered.
First of all, a well thought out investment plan and a well-constructed investment portfolio should keep volatility within the investor’s acceptable limits, regardless of the reason for any potential volatility. So election year or not, the first question that needs to be addressed is whether or not your investment portfolio is suitable for your risk tolerance.
Secondly, investors need to understand what drives stock market returns. Over the longer term – three to five years or longer – earnings and inflation tend to be the primary drivers of equity returns, studies show. In the shorter term, psychology (fear and greed) is the major cause of volatility on both the upside and the downside. So when an investor is concerned about the election or any other event, the best questions to ask center around how the economy (earnings and inflation) will be affected by policies put in place by the expected winner. The shorter term fluctuations regarding psychology (fear and greed) can be difficult to predict and they happen all the time.
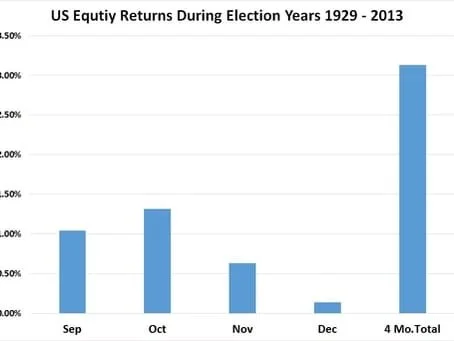
Having said this, I did a study to see how the stock market has performed for the two months leading up to and past the election for all election years going back to 1929. The results were fairly surprising to me. There were twenty-two elections. The average return not counting dividends for the four months during those twenty-two years was 3.13% with a standard deviation of 11.12%. In English this means that that returns averaged 3.13% and about two thirds of the time the range during those months was constrained between a minus 7.99% and positive 14.25% plus dividends. Surprisingly September and October (1.04% and 1.32%) had better average positive price changes than November and December (0.63% and 0.14%). I say surprisingly because September and October are infamous for being seasonally weak while November and December are typically stronger months.

The worst four month run was in 1929 as the Great Depression was getting cranked up with a negative 32.62% with September and October (-10.58% and -26.47%) being negative and November and December (3.98% and 1.45%) being positive. Hopefully we can dismiss that cycle as an aberration but it’s still included in the averages that I quoted. The best four month run was in 1945 as World War II was ending. If we discard the best and the worst year – both considered prewar history – the numbers change some. The best and worst periods then change to a positive 12.61% and a negative 22.31%. The negative year was in 1937 which was right in the middle of the Great Depression following one of the best five year runs that the stock market has ever seen (that’s right, it happened in the middle of the Great Depression) so again, we have to look at these election year cycles in a much broader context. The average four month return without those numbers drops to 0.40% without dividends but the standard deviation, or volatility dropped to 8.67%. In order to find the next worse negative year we have to go to 1941. Once again World War II was raging and it is not considered modern financial history by many.
Essentially, what I have attempted to illustrate is the short term historical behavior around past elections. Educated investors are less likely to make rash, emotional decisions in my opinion. Once the shorter term outlook has been addressed, the longer term can be examined. But again, the record needs to be looked at in the broader context of what was happening in the world at the time and that’s beyond the scope of this article. In closing let me reiterate that long term stock market returns have always been and I believe always will be driven primarily by earnings and inflation. So what you want to ask yourself is what policies will actually make it from a campaign speech into actual policy and then assess the potential effects of those policies. I think that the wiser choice is to ferret out the winners and losers within the markets that will surely show themselves as policies change as opposed to worrying about the immediate effect of the election results on the general stock markets. Policies generally take a while to get implemented and potential dislocations should be looked at as opportunities.