Get the Picture?

Value Line (Geometric) Average. The Value Line Geometric Composite Index is the original index released, and launched on June 30, 1961. It is an equally weighted index using a geometric average. Because it is based on a geometric average the daily change is closest to the median stock price change.
-Investopedia
I started my career in the investment business in 1991. Back then there were a lot of great regional investment firms with still familiar names. The one I worked for was A.G. Edwards and Sons, Inc. Being a stock broker was a fun job before the internet shoved traditional stock and bond brokers toward obsolescence allowing the big banks to swoop in to destroy what was left of their great cultures. In 1991 the stock market was a little over half way through the greatest bull market in US history. We were all a little more naive back then and the investing public had all but forgotten the bear market of the late '60's and '70's.
Then, (seemingly) out of nowhere the Tech Wreck hit soon to be followed by the Housing Bubble. So now, whenever stocks show the least bit of volatility it's only natural for investors to be conditioned to expect the worst. In February of this year stocks entered into a correction. In our opinion it was only a correction and NOT the start of something more serious and we have written about this in past missives. Corrections are something to tolerate while true secular bear markets are something to avoid, in our opinion. Therefore it is important to attempt to distinguish between the two.
Click Chart to Enlarge
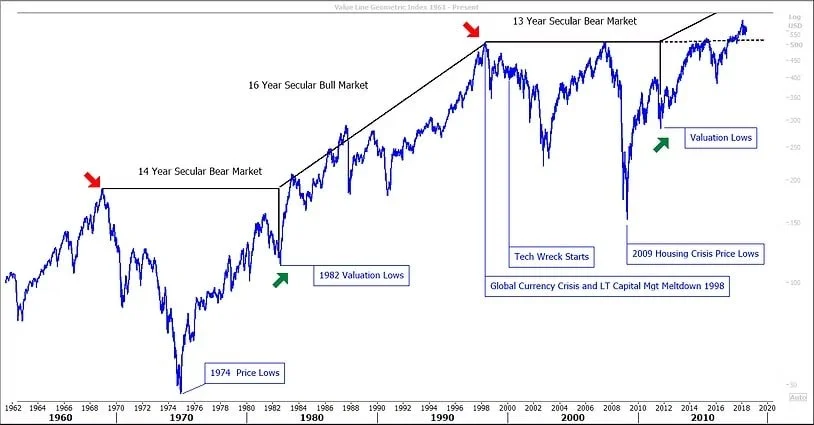
Chart - Value Line Geometric Index 1961 - Present
If you ask the average non-professional investor when the last bear market started they would probably say either 2000 when the Tech Wreck hit or late 2007 when the Housing Crisis and the Great Recession started. In our opinion they would be wrong. By looking at the Value Line Geometric index, one can get a better understanding of when the average stock started its descent and how long the last bear market and the previous bull and bear markets lasted. Most stocks started going down in 1998 - well before the Tech Wreck became obvious. We think the last Secular Bear Market ended in 2011 and a new Secular Bull Market emerged. Since Secular Bull Markets, as we count them, have historically lasted 14 years or more with the last one being about 16 years in duration, we think that this bull could have many years left to run. Also, a cursory glance at the attached chart shows that the average stock just started hitting new all time highs in late 2016 and early 2017, further confirming our Secular Bull Market Thesis. So while there will surely be corrections along the way, we do not currently have the evidence to suggest that a new secular bear market is lurking nearby. This last correction, at least so far, is barely a wiggle on the chart in the greater scheme of things. Click on the chart above to get a better view.