In Case you Haven’t Heard
I hate to be the bearer of bad news but…various parts of the yield curve have started to invert. If I haven’t already lost you, please read on. This is important. First let me explain what the yield curve is, what it means for it to invert and what the playbook is for dealing with it.
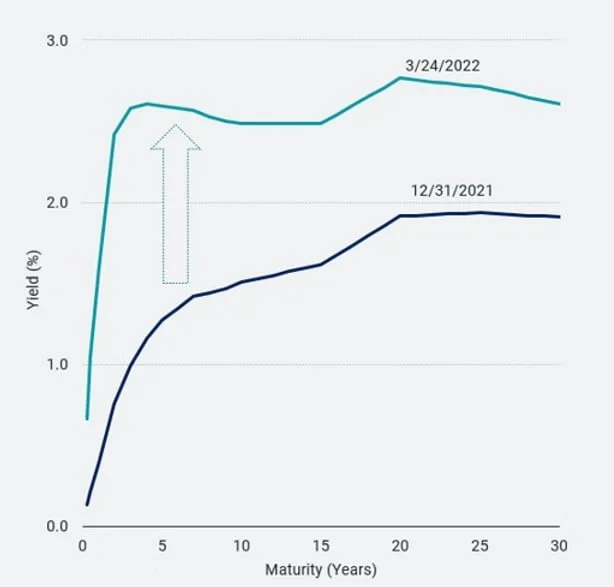
According to Investopedia, “A yield curve is a line that plots yields (interest rates) of bonds having equal credit quality but differing maturity dates.” All that means is that the yield curve is a graph that shows the interest rates paid for all maturities of a particular bond issuer like the Unites States Government. Normally the yield curve is said to be positively sloped with shorter term yields lower than longer term yields. So, when you look at the graph the line goes from the lower left to the upper right. But sometimes this relationship gets out of whack and shorter-term rates become higher than longer term rates. When this happens, the yield curve is said to be inverted. The reason that this is important is that an inverted yield curve has historically been a good predictor of impending recessions. However, there has typically a lag between the onset of a recession and / or the peak in previous bull markets.
Treasury Yield Curve on 12/31/21 & 3/24/22
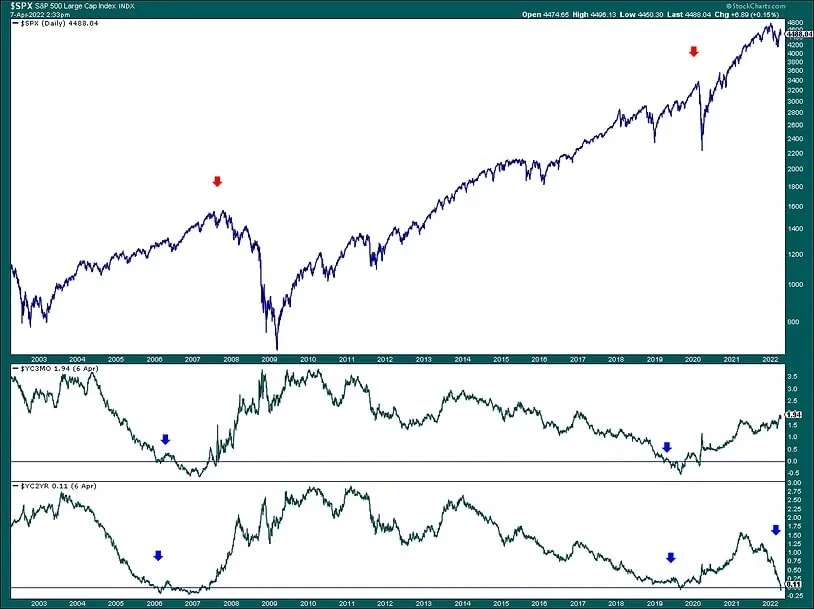
The chart below shows the S&P 500 with the slopes of two yield curves plotted below it. The first one shows the difference between the three-month yield and the ten-year yield (10 yr / 3mo). The second chart shows the spread between the two-year yield and the ten-year yield (10 yr / 2 yr). A quick glance at the chart shows that while the ten-year two-year curve has slightly inverted, the ten-year three-month yield is nowhere near inverting although we do expect it to do so eventually. We think the second of these curves (10 yr / 3 mo.) is the most important curve to monitor.
So, what’s an investor to do? Well, probably nothing for now because going back to 1978 the average time from inversion of the 10 yr / 2 yr curve to recession has been 16 months. The shortest lag was 7 months and the longest was 25. Also, the 10 yr 3 mo. curve has not yet inverted. For now, we think this is more of a situation to be monitored closely than to be acted upon. But it is time for investors to start thinking about what to do when the evidence becomes more pronounced. And obviously, everybody has different risk tolerances, liquidity needs and time horizons so the ‘right’ answer probably depends on the individual investor.