How to Invest if You Think Stocks are Expensive & Interest Rates are Low

It’s taken me awhile to get here but I do believe that the Great Recession caused by the housing crisis of 2007 - 2009 is behind us and a new Secular Bull Market in U.S. and Global Equities is well under way. However, not everybody shares this point of view. After all, the S&P 500 has increased in price by over 200% since the March 2009 lows with only one correction that came close to the 20% drop that most people use to define a bear market. And that event was way back in 2011. Fortunately bear markets aren’t caused solely by the mere passage of time. And while high valuations can increase the magnitude of a bear market given the proper catalyst, a high valuation in and of itself hasn’t historically been enough to be the sole cause of major bear markets. Every significant bear market that I have ever studied has been caused by a shock to the economy (think recession) and / or a shock to price levels (think interest rates and currencies). With the information that I have today, I personally don’t see either of those catalysts on the near term horizon right now.
However, since discretion is the better part of valor, some investors might find themselves eager to dial back their risk exposure for a while. The logical place for conservative investors who want to lighten or eliminate exposure to stock market risk while maintaining liquidity therefore defaults to the bond market. But interest rates have been dropping since 1982 and the 10 year treasury yield stands at a measly 2.28% as of this writing. If interest rates do reverse the long term trend that started in 1982 then the conservative investor could find herself out of the frying pan and into the fire.
So what’s a conservative investor to do? Fortunately I don’t have to invent the answer because the legendary Marty Zweig gave us what I believe to be a great answer in his 1986 book, Winning with New IRAs. Dr. Zweig wrote about a simple model that incorporated two trend following indicators and two indicators designed to keep the bond investor in sync with the Fed. The model was back tested from 1966 through 1986 and the performance of the model was impressive on both an absolute and a risk adjusted basis. This is quite an amazing feat because most of the time period tested was brutal for bond investors as interest rates eventually rose to unprecedented levels. In the 2014 book, Being Right or Making Money 6th Edition, published by Ned Davis Research, the authors published the results of the same model since 1986 and found that the model was robust after the fact. This is an important point because many people today are presenting back tested results that are nothing more than data mining. What this means that unless there is some economic justification for the factors used to generate those back tested results, the odds of that past performance being replicated in the future is completely random. The Zweig Bond Model incorporates factors into the model that pass the economic test.
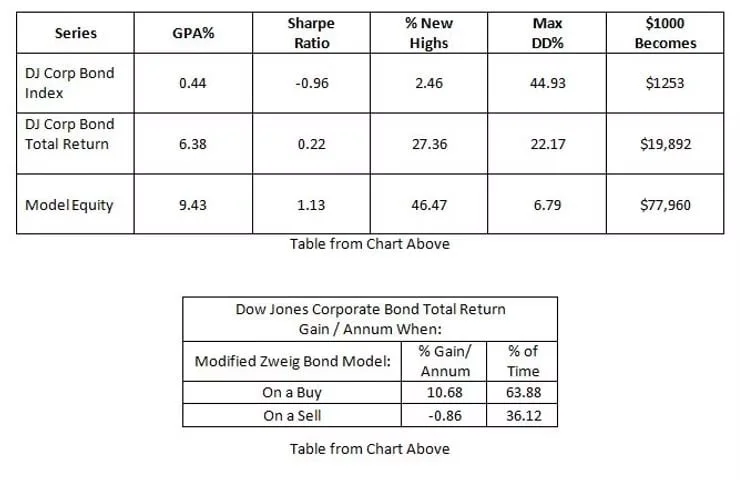
After testing the model since 1986, NDR made some minor changes to improve the risk management parameters of the model. The improved model that they published is called ‘The Modified Zweig Bond Model’ and the results and the rules are illustrated in the chart below. Pay particular attention to the model drawdown and performance relative to the Dow Jones Corporate Bond Index and I think you’ll see why I like the strategy for conservative investors.
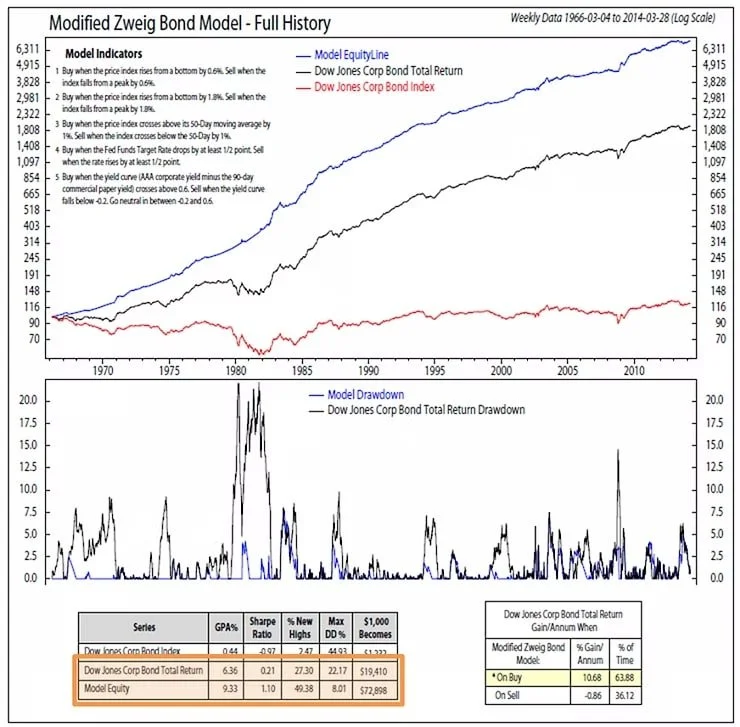
Source: Being Right or Making Money 6th Edition
Model Indicators (from the Chart above and Making Money or Being Right 6th Edition)
1) Buy when the price index rises from a bottom by 0.6%. Sell when the index falls from a peak by 0.6%.
2) Buy when the price index rises from a bottom by 1.8%. Sell when the price index falls from a peak by 1.8%.
3) Buy when the price index crosses above its 50-Day moving average by 1%. Sell when the index drops below the 50-Day moving average by 1%.
4) Buy when the Fed Funds Target Rate drops by at least ½ point. Sell when the rate rises by ½ point.
5) Buy when the yield curve (AAA corporate yield minus the 90-day commercial paper yield) crosses above 0.6. Sell when the yield curve falls below -0.2. Go neutral in between -0.2 and 0.6.
In order to signal a new buy signal, three or more of the five indicators need to indicate a buy signal. In order to generate a new sell signal, three of the five indicators need to indicate a sell signal.
The commentary on this website reflects the personal opinions, viewpoints and analyses of James Tharin and Emerald Asset Management, Inc. and should not be regarded as a description of advisory services provided by Emerald Asset Management, Inc. or performance returns of any Emerald Asset Management, Inc.’s Investments client. The views reflected in the commentary are subject to change at any time without notice. Nothing on this website constitutes investment advice, performance data or any recommendation that any particular security, portfolio of securities, transaction or investment strategy is suitable for any specific person. Any mention of a particular security and related performance data is not a recommendation to buy or sell that security. Emerald Asset Management, Inc. manages its clients’ accounts using a variety of investment techniques and strategies, which are not necessarily discussed in the commentary. Investments in securities involve the risk of loss. Past performance is no guarantee of future results.